


Preparation of GO sheets with controllable lateral sizes
Aqueous dispersions of GO with broad size distributions, synthesized by means of a modified Hummer’s method37, were purchased from Nanjing XFNANO Materials Tech Co., Ltd. Temperature-controlled fractionated centrifugation was used to separate the polydisperse GO dispersions into several distinct size groups. To measure the lateral size of the GO nanosheets, droplets of the GO dispersion were deposited on silicon wafers and air dried. Lateral size distributions were determined from atomic force microscopy images (Supplementary Fig. 17) by analysing more than 500 nanosheets per sample. The average lateral size of irregularly shaped GO nanosheets was calculated as the mean of their largest and smallest transverse widths. The sorted GO fractions were immersed in water and stored at 4 °C to prevent aggregation. For this study, the roughly 2-μm GO size fraction was selected on the basis of its optimal performance characteristics (Supplementary Fig. 18).
Preparation of GO with varying oxidation degrees
GOs with different oxidation levels were prepared using a modified Hummer’s method37. Four GO samples with varying degrees of oxidation, covering a wide range of oxygen content, were synthesized by adjusting the amount of oxidant (KMnO4) and oxidation time during the preparation process. It was observed that freshly prepared GO samples showed non-uniform sizes, with smaller GO sheets generally having higher oxidation degree. A patchwork GOM with fewer oxygen-containing functional groups showed higher permeability at the same interlayer spacing, whereas membranes with strong binding pillars required appropriate oxidation to provide robust linking and support, preventing swelling and collapse. On the basis of these characteristics, membranes with 25.4% oxygen content oxidation showed optimal performance in composite GOMs, compared with the typical 30.6% oxygen content (Supplementary Fig. 19). Furthermore, the GOs with varying oxidation degrees were subjected to fractionated centrifugation before membrane preparation to ensure optimal performance in composite GOMs.
Preparation of GOMs
The prepared size-graded GO sheets were diluted to a concentration of 2 μg ml−1. The diluted suspension was then filtered under a vacuum pressure of roughly 0.01–0.02 MPa through microporous substrates (cellulose, nylon, polyethersulfone or anodized aluminium oxide and so on) or alumina ceramic tubes, all with a pore size of roughly 0.22 μm, to form GO films. In the experiment, the operation with lower concentration and lower vacuum pressure provided sufficient time for the GO sheets to spread uniformly, resulting in flat and consistent membrane. The GOMs were subsequently freeze dried using a freeze dryer (LGJ-10E, Sihuankeyi Co., Ltd).
Preparation of the composite GOMs
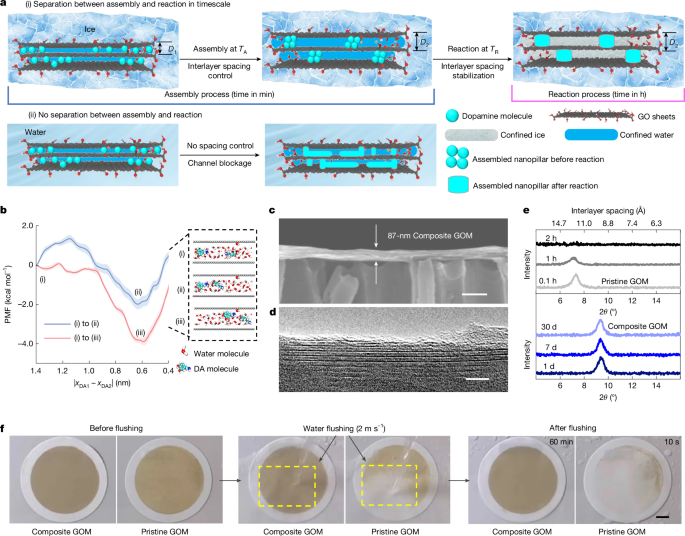
The freeze-dried GOMs were immersed in aqueous solutions of reactive molecules (for example, DA) at various concentrations (0.03 mM, 0.06 mM, 0.13 mM, 0.33 mM, 0.65 mM and 1.3 mM, pH 7.5) for 1–3 min (Supplementary Fig. 1). The solution volume was carefully controlled to infiltrate the membrane sufficiently while preventing rapid swelling into disordered, stacked GO sheets. The membranes were then frozen at temperatures below −50 °C. Unlike traditional immersion strategies that result in uncontrolled swelling, the frozen surrounding bulk ice extracted some liquid water in confinement from the GOM interlayers, thereby minimizing the initial interlayer spacing. This process was followed by annealing below the bulk ice freezing point (for example, −10 °C) for various annealing times to achieve the desired GOM interlayer spacing. Then, the GOMs were cooled to below −30 °C for the reaction process. The GOMs were subsequently freeze dried to obtain the PDA-crosslinked GOM (composite GOM).
Building on this approach, the mixed solution of benzene-1,2,4,5-tetramine (P) and benzene-1,3,5-tricarboxylic acid (A) in a 3:2 ratio was used to fabricate the poly-PA-crosslinked GOM. During the reaction, the P and A molecules underwent copolymerization. For freeze-dried GOM treated with aqueous acrylamide solutions, the membrane was further exposed to ultraviolet light for 1 h, yielding poly-AM-crosslinked GOM membranes (Supplementary Fig. 6). In our approach, we introduced this mechanism to achieve the separation of reactive molecular assembly and subsequent reactions. It prevented the imprecise spacing regulation and channel blockage from excessive reacted molecules to flux reduction, which can possibly arise from simultaneous assembly and reaction or from relying solely on chemical reactions for interlayer stabilization6.
PVA-modified anodic aluminium oxide ceramic tube surface
Polyvinyl alcohol (PVA) was dissolved in water and heated to 95 °C to prepare a 1 wt% aqueous solution. Ceramic tubes were immersed in the PVA solution for 1 h to deposit the PVA on the substrate surface. The tubes were then rinsed with deionized water and left to dry naturally at room temperature for 12 h, resulting in PVA-modified ceramic tubes. This modification improved the adhesion between the ceramic substrate and the GO-based membrane.
Configuration of filtration device with the GOMs
The filtration device consisted of a flexible, flat and reinforced composite GOM securely adhered to a cylindrical hydrophilic-modified ceramic tube for mechanical stability of composite GOMs. The feed solution was pumped through the composite-GOM filtration system, with the retentate being recycled while the permeate water was collected, as shown in Fig. 4a.
Low-temperature differential scanning calorimetry measurements
We conducted low-temperature differential scanning calorimetry measurements on membrane-GOMs with different interlayer spacings to determine the freezing behaviour of nanoconfined water. As shown in Extended Data Fig. 1, differential scanning calorimetry thermograms showed distinct crystallization peaks as the temperature decreased from −10 °C to −30 °C. On the basis of the precedent set in the literature38, the higher-temperature peak was attributed to bulk-like water freezing, whereas the lower-temperature peak corresponded to the freezing of confined water. Compared with the exothermic peak of bulk water freezing, the exothermic peak of confined water freezing was much smaller, with a reduced peak area. Therefore, to better show the freezing temperature of confined water in membranes with different interlayer spacings, we have amplified the confined water crystallization peak (Extended Data Fig. 1a). The freezing temperature of confined water decreased as the interlayer spacing decreased, as shown in Extended Data Fig. 1b. Moreover, in some cases (for example, between −5 °C and −15 °C), only a single broad peak was observed, which we attributed to the overlap of bulk and confined water crystallization transitions (not shown here). In addition, the limited exothermic heat released during the crystallization of confined water resulted in a melting process that was much smaller compared with bulk ice melting. As a result, the melting peak of confined ice was overshadowed by the melting peak of bulk ice.
In situ XRD for frozen samples
The frozen GOMs were placed in a sealed temperature-controlled system integrated with XRD apparatus (PANalytical) for analysis. The interlayer spacing was measured by using powder XRD with the angular range of 3–80° (2θ) at a scanning speed of 10° min−1 with the Cu Kα radiation (wavelength λ = 1.54056 Å).
Measurement of the interlayer spacing of GOMs
The interlayer spacing was measured by using powder XRD with the angular range of 3–30° (2θ) at a scanning speed of 5° min−1 by using an X-ray diffractometer (PANalytical) and the wavelength of the Cu Kα radiation (λ = 1.54056 Å). The Bragg equation 2dsinθ = nλ was used to calculate the interlayer spacing.
Synchrotron radiation source for testing GOMs in dry state
The synchrotron grazing-incidence wide-angle X-ray scattering two-dimensional (2D) patterns were collected on the BL14B1 and BL16B1 beamlines at Shanghai Synchrotron Radiation Facility, using a fixed wavelength of 1.2398 Å (10 keV), an exposure time of 200 s and an incident angle of 0.2°. The relationship between the 2θ and interlayer spacing was calculated from the grazing-incidence wide-angle X-ray scattering 2D patterns through the open access software of FIT2D.
Electron microscopy characterization
GO dispersions were deposited onto TEM grids on a filter paper. DA solutions at varying concentrations (0.03 mM, 0.06 mM, 0.13 mM, 0.33 mM, 0.65 mM and 1.3 mM) were subsequently added to infiltrate the GO layer on the grids. Then we followed the method of preparing composite-GOM samples to first rapidly freeze the GOMs, followed by annealing to obtain the target composite GOMs for TEM imaging. High-resolution TEM images were obtained at the acceleration voltage of 200 kV on a JEM-2100F electron microscope.
Moreover, some morphologies images were examined at 5 kV using a field-emission scanning electron microscope instrument (Hitachi S-4800).
Evaluation of membrane performance
The performance of the GOMs was evaluated using a cylinder-shaped filtration cell for testing the composite GOM supported by ceramic substrates with an effective membrane area of 10.6 cm2 shown in Supplementary Figs. 13 and 20. For the cylinder-shaped filtration cell, taking permeation tests of 2,000 ppm NaCl as an example, the composite GOM was placed on the cylindrical ceramic substrate, with the composite-GOM layer facing the feed NaCl solution. The NaCl aqueous solution was pumped into the cell through the inlet as the feed solution and exited through the outlet as the retentate. After the system reaching steady-state, the permeates were collected after passing through the composite GOM was recorded as the permeate solution for subsequent analysis. The process was conducted at room temperature, with an operating pressure of 5 bar and a cross-flow rate of 50 l h−1.
The water permeance (Jw) was determined by means of the equation:
$${J}_{{\rm{w}}}=\frac{\Delta V}{\Delta t\times A\times \Delta P}$$
where Jw is the water permeance (l m−2 h−1 bar−1), ΔV is the volume of permeate solution (in l), Δt is the test time (h), A is the effective membrane area (m2) and ΔP is the transmembrane pressure difference (bar).
The single salt rejection (R) was calculated by using the equation7,39:
$$R=1-\frac{{C}_{{\rm{permeate}}}}{{C}_{{\rm{feed}}}}\times 100{\rm{ \% }}$$
where Cpermeate is the concentration of a specific target salt in the permeate solution and Cfeed is the concentration of the same target salt in the feed solution. The conductivity of the permeate solution was measured using a conductivity meter (Mettler-Toledo), and ion chromatography (Thermo Fisher Scientific).
The salt concentration can be calculated using the equation:
$$C=\frac{\kappa }{{\varLambda }_{{\rm{m}}}}$$
where C is the salt concentration, κ is the measured conductivity and Λm is the molar conductivity. Within the salt concentration range tested in this work, the conductivity showed a linear relationship with concentration, thus allowing the salt rejection to be determined from conductivity measurements.
The selectivity coefficient, SA,B, for ion A over ion B was quantitatively determined using equation:
$${S}_{{\rm{A}},{\rm{B}}}=\frac{\frac{{C}_{{\rm{permeate}},{\rm{A}}}}{{C}_{{\rm{feed}},{\rm{A}}}}}{\frac{{C}_{{\rm{permeate}},{\rm{B}}}}{{C}_{{\rm{feed}},{\rm{B}}}}}$$
where, Cfeed,A and Cfeed,B correspond to the concentrations of ion A and ion B in the feed solution, whereas Cpermeate,A and Cpermeate,B represent the concentrations of ion A and ion B in the permeate. Specifically, In Fig. 4h,i, only the main metal-ion species are presented for clarity. The total ion fraction does not sum to unity because Ca2+ are not shown. Metal-ion concentrations were measured using inductively coupled plasma spectroscopy (iCAP RQ, Thermo Fisher Scientific). At the same time, anion concentrations were determined by ion chromatography (Thermo Fisher Scientific).
The ion permeation rate (Ji) was calculated according to the equation:
$${J}_{{\rm{i}}}=\frac{V\times {C}_{\mathrm{ion}}}{A\times \Delta t}$$
where V is the effective volume of the permeate solution, Cion is the ion concentration in the permeate side, A is the effective membrane area and Δt is the permeation time.
In addition, we conducted ion-sieving and permeation tests of pretreated seawater (as a feed solution, seawater was obtained from China Bohai). In this work, after pretreatment, the Li+ concentration reached roughly 0.3 ppm and the treated seawater was used as the feed solution in Fig. 4h. Also, when the Rb+ concentration reached roughly 0.03 ppm, it was used as the feed solution in Fig. 4i. Therefore, the membrane performance discussed in this work was evaluated from a defined feed solution obtained after pretreatment, rather than directly from raw seawater.
Surface zeta potential measurements
Zeta potentials of the membrane surface were calculated by streaming potential measurements by an electrokinetic analyser (Anton Paar, SurPASS), in which 1 mM of KCl solution under neutral conditions was passed over the membrane surface.
To systematically evaluate the role of surface charge in ion separation within composite GOMs, we measured the surface zeta potentials of composite GOMs with different interlayer spacings40. As shown in Extended Data Fig. 10, despite significant variations in interlayer spacing, the zeta potential values remained largely consistent across all membranes, indicating that the confinement-driven molecular assembly does not alter the membrane surface charge characteristics. The key finding was that despite similar surface charge states, membranes with different interlayer spacings showed distinct metal-ion separation performance (Extended Data Fig. 6). This comparative result confirmed that surface charge did not play a dominant role in the ion-sieving process within composite GOM.
Atomic force microscopy characterizations
The Multimode 8 (Bruker) was used to characterize the morphology and size of GO sheets.
Optical characterization
Digital photographs were taken with a Nikon eclipse LVDIA-N microscope equipped with a CCD (DS-Ri2).
Molecular dynamics simulations
The simulation system contained 2 GO sheets, 4 DA molecules and about 1,800 water molecules in a box with the dimensions 50.92 × 50.40 × 30.00 Å3 (Supplementary Fig. 21). The periodic boundary conditions were applied to all three dimensions in the simulation. To simulate the original graphene region and the GO region, we reduced the oxidation degree of GO sheets with a formula of C20O1(OH)1, which contained 39 hydroxyl groups (–OH) and 39 epoxy groups (–O–). In the simulation, the C atoms were fixed in the y direction to keep the interlayer spacing at 10 Å. The simulation was carried out in the constant-temperature-volume (NVT) ensemble with a time step of 1 fs. The temperature was kept at 260 K by a velocity-rescale thermostat41. Each simulation was run for 40 ns, with the last 30 ns being used for data analysis. An all-atom optimized potential for liquid simulations was used for GO sheets and DA molecules42, and the TIP4P/2005 water model was applied for water molecules43. Lennard–Jones and Coulomb potentials were used to simulate non-bonding interactions, with the electrostatic interactions being calculated using the particle mesh Ewald summation method44 and a 10-Å real-space cut-off for non-bonding interactions. The LINCS algorithm was used to constrain covalent bonds and angles45. The free-energy profile of DA molecules confined in GO nanosheets was computed using the umbrella sampling method. Free energies were estimated using the weighted histogram analysis method46. All classical molecular dynamics simulations were conducted using the GROMACS package47. The program VMD was used for data analysis and molecular graphics48.
Density functional theory calculations
All density functional theory calculations were performed using Gaussian 09 software49. The electronic structural optimization and reaction barrier calculation were performed based on an implicit water solvent model at the B3LYP/6-311++G** level50 with Grimme’s dispersion corrections51. The hydration energies of ion-water clusters (ion-(H2O)6) for Rb+, K+, Na+ and Li+ were further calculated at the B3LYP level with a mixed basis set: the Stuttgart/Dresden effective core potential (SDD) pseudopotential for the cations and the 6-311++G** basis set for water molecules. Basis set superposition error corrections were applied to the hydration-energy calculations.

