


Plant materials, growth conditions and stress treatment
All the Arabidopsis thaliana mutants and transgenic plants used in this study were in the Columbia (Col-0) background. The T-DNA insertion mutant sam8-1 (SALK_065676) was ordered from the AraShare. The sam8-2 is a CRISPR-edited allele carrying a 1-bp insertion 39 bp downstream of the start codon, which introduces a frameshift and premature stop codon. The resulting protein is MAELQLVEGHQINRRFYPAGDNKLNRSTGNIRRSRSFSRIETIEKT*. The ok130-null mutant was provided by Prof. Pengcheng Wang (Southern University of Science and Technology). Seeds were surface sterilized with 2.5% (v/v) sodium hypochlorite and 70% (v/v) ethanol, stratified for 3 days in the dark at 4 °C, and sown on half-strength Murashige and Skoog (MS), 0.8% (w/v) agar plates supplemented with 1% (w/v) sucrose. Plate media were transferred to a growth chamber under a long-day (16 h light 22 °C/8 h dark 18 °C) photoperiod.
For the germination kinetic assay, all seeds of the indicated genotypes were harvested on the same date from plants grown under identical conditions. They were then uniformly dried at 37 °C for 2 weeks to ensure a consistent after-ripening process. Subsequently, the seeds were sown on the same batch of medium and placed in a growth chamber without stratification under a long-day photoperiod (16 h light at 22 °C/8 h dark at 18 °C). Germination rate was calculated as the mean percentage of seeds that had ruptured their seed coats. Each genotype was evaluated in three biological replicates, each comprising approximately 300 seeds.
For direct osmotic stress treatment, sterilized seeds of different genotypes were germinated on 1/2 MS medium supplemented with 300 mM d-mannitol (Solarbio, M8141) and grown at 22 °C or 26 °C. The phenotypes were recorded at 12 days post-germination. Survival was determined by the ability of seedlings to resume growth after stress removal. Specifically, seedlings were returned to 1/2 MS medium following stress treatment, and survival was assessed 7 days later. Seedlings that remained green and produced new tissues (for example, true leaves) were counted as survivors, whereas those that became white or brown and failed to resume growth were scored as non-survivors. For the transfer assay, sterilized seeds of Col-0 and sam8-1 were germinated on standard half-strength MS medium at 22 °C for 3 days, then transferred to a medium containing 750 mM d-mannitol and grown vertically at 22 °C or 26 °C for 5 days. After treatment, the seedlings were transferred back to normal medium and grown at 22 °C for 10 days before phenotypes were recorded.
For the root extension assay, 5-day-old seedlings grown on standard half-strength MS medium were transferred to a medium containing mannitol and grown vertically for 10 days. For meristem zone measurement, the seedlings were imaged under differential interference contrast of a Nikon AXR with NSPARC confocal microscope system using a 100×/1.45 oil objective 2 days after transfer. The length of the meristem zone was quantified from the QC (Quiescent Center) to the first elongated cell. For the extension rate analysis, root length was measured every day, and the rate was calculated as mm per day.
Plasmid construction
To generate the pSAM8::SAM8-mVenus construct, a 2.2-kb promoter and a 1-kb 3′ untranslated region (UTR) were amplified from wild-type Col-0 genomic DNA and cloned into the pCAMBIA1300-mVenus vector51, giving rise to the pSAM8::mVenus-UTR construct. The coding sequence of SAM8 was amplified and inserted between the promoter and mVenus. For SAM8 variants, site-directed mutagenesis or domain deletion was performed with a standard two-step polymerase chain reaction (PCR) and verified by DNA sequencing to generate the coding sequences of SAM8ΔIDR1, SAM8ΔIDR2, SAM8IDR3mQ, SAM8IDR3mS, SAM8IDR3mK, SAM8IDR3mR, SAM8ΔSAM and SAM8RRKm. All coding sequences were cloned into the pSAM8::mVenus-UTR vector.
To generate the sam8-2 mutant, two sgRNAs were designed and inserted into the BbsI sites of the pAtU6-26-M vector. The Cas9 cassettes were subcloned into pCambia1300-UBQ:Cas9-P2A-GFP-rbcS-E9t vector52 (digested with KpnI and EcoRI). All constructs were introduced into Agrobacterium tumefaciens strain GV3101 and transformed into sam8-1 mutant plants using the standard floral-dipping method. Positive transformants were selected on half-strength MS medium containing 30 mg l−1 hygromycin (AMRESCO, K547). Homozygous transgenic lines were used for experiments. For the sam8-2 mutant, Cas9-free plants were used for experiments.
For the constructs used in transient expression in tobacco epidermal cells, the coding sequences of SAM8 and its variants, ALY1/2/3/4, eIF4A3, UAP56B and NUL1 were amplified and inserted into the pCAMBIA1300-35S-mVenus/NmVenus/CmVenus/Flag/mCerulean/mCherry vector51 (digested with KpnI). The same construct was used for generating overexpression transgenic lines where necessary.
To generate the constructs used for heterologous expression in yeast cells, the coding sequences of SAM8 and its variants were amplified and inserted into the pDUAL-Pnmt1-yeGFP vector53 (digested with NheI and BamHI).
To generate the constructs used for in vitro protein expression, the coding sequences of SAM8 and its variants, ALY1/2/3/4, eIF4A3, UAP56B, SAM7 and SOSEKI1 were amplified and inserted into the pET11-6×His, pET11-6×His-GFP, pET11-6×His-mCherry or pET11-6×His-BFP expression vector11 (digested with NheI). Where necessary, a maltose-binding protein (MBP) solubility tag was placed at the N-terminus of the construct, followed by a tobacco etch virus protease (TEV) cleavage site. To generate the constructs used for micropolarity assay, the coding sequences of MBP-SAM8 or MBP-SAM8IDR3mQ were amplified and inserted into the p1-Halo-pET29b expression vector (digested with NheI and BamHI).
All cloning was performed using the ClonExpress II One Step Cloning kit (Vazyme, C115). The primer sequences used in this study are provided in Supplementary Table 3.
In vitro protein expression and purification
All proteins were expressed and purified from Escherichia coli (Rosetta) cells using Ni-NTA resin as described previously54. Briefly, protein expression was induced by 0.4 mM isopropyl-β-D-1-thiogalactopyranoside (IPTG) at 15 °C overnight. Cells were collected by centrifugation and resuspended in lysis buffer (40 mM Tris-HCl pH 7.4, 500 mM NaCl, 10% glycerol). The suspension was sonicated for 20 min (3 s on, 6 s off, SCIENTZ) and centrifuged at 12,000g for 60 min at 4 °C. The supernatant was incubated with Ni-NTA agarose for 20 min and washed five times with wash buffer (40 mM Tris-HCl pH 7.4, 500 mM NaCl, 20 mM Imidazole) and eluted with elution buffer (40 mM Tris-HCl pH 7.4, 500 mM NaCl, 500 mM Imidazole). Proteins were purified by gel filtration chromatography (Superdex-200; GE Healthcare) and stored in the buffer (40 mM Tris-HCl pH 7.4, 500 mM NaCl, 1 mM DTT) at 4 °C.
Size-exclusion chromatography coupled with multi-angle laser light scattering
Size-exclusion chromatography coupled with multi-angle laser light scattering was performed as described previously55. Briefly, chromatography was performed in 40 mM Tris-HCl, pH 7.4 and 500 mM NaCl using a Superdex-200 10/300 GL size-exclusion column (GE Healthcare). The concentrations of MBP-SAM, MBP-SAMRRKm, MBP-SAM8, MBP-SAM7 and MBP-SOSKEI1 used for this assay are 2 mg ml−1, 2 mg ml−1, 5 mg ml−1 and 5 mg ml−1, respectively. The chromatography system was connected to a Wyatt DAWN HELEOS laser photometer and a Wyatt Optilab T-rEX differential refractometer. Wyatt ASTRA v.7.3.2 software was used for data analysis.
Dynamic light scattering measurement
SAM8 protein of 2 mg ml−1 in 40 mM Tris-HCl, pH 7.4, 100 mM NaCl was used for Dynamic light scattering (DLS) measurement. The protein sample of 100 μl was transferred into a quartz cuvette (WYATT, JC-0247). DLS measurements were performed using DynaPro NanoStar (Wyatt). Each data point was collected from 10 to 30 acquisitions. The data were analysed using the DYNAMICS software using a cumulant fit to the autocorrelation function.
Yeast transformation for heterologous expression
The plasmids were linearized with NotI, and the resulting fragments were gel-purified and transformed into the fission yeast strain LD328 (genotype his3-D1 leu1-32) as described previously56. Briefly, yeast cells were cultured until the OD600 reached 0.4–0.8. For each reaction, 500 μl of cultured cells were collected, washed three times with sterilized water and resuspended in buffer I (240 μl of 50% PEG3350, 36 μl of 1.0 M LiAc and 50 μl of 2.0 mg ml−1 carrier DNA). The linearized DNA (34 μl, up to 1 μg) was added to the resuspended cells, mixed vigorously and incubated at 42 °C for 40 min. The cells were collected and resuspended in 100 μl of water, then plated on EMM + HT (EMM medium supplemented with 45 mg l−1 histidine and 15 μM thiamine) plates. After incubation at 30 °C for 2–3 days, individual colonies were selected on EMM + H (EMM medium supplemented with 45 mg l−1 histidine) plates. The cells were used for subsequent imaging analyses.
Fluorescence imaging of cells and tissues
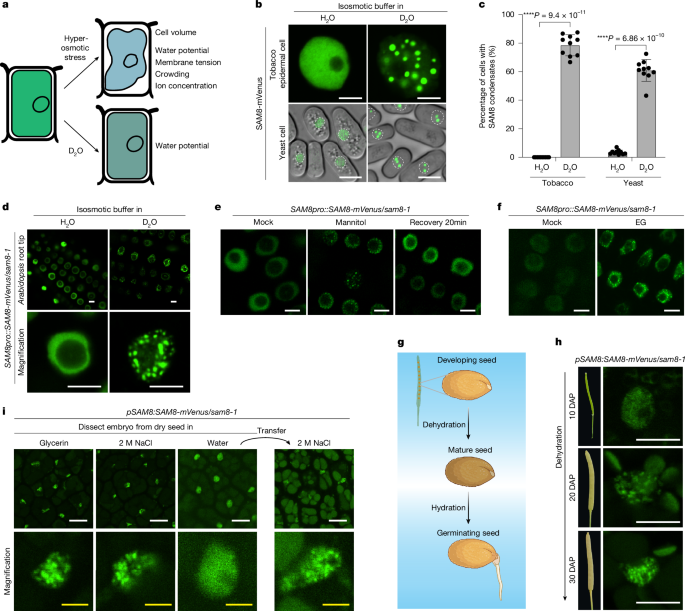
Five-day-old Arabidopsis seedlings or tobacco leaves were soaked in liquid half-strength MS medium supplemented with or without d-mannitol, PEG8000, EG, or isosmotic buffer prepared with heavy water (SIGMA, 151882). After treatment, the root tip or a small leaf disc was mounted on a slide, covered with a coverslip and immediately imaged under a Zeiss LSM880 confocal microscope using a 100×/1.40 oil objective or a Nikon AXR with NSPARC confocal microscope system using a 100×/1.45 oil objective. GFP was excited at 488 nm and detected at 491–535 nm; mVenus was excited at 514 nm and detected at 529–570 nm; mCherry was excited at 561 nm and detected at 575–625 nm; and mCerulean or BFP was excited at 405 nm and detected at 410–507 nm. The channels of mVenus, mCerulean and mCherry were acquired sequentially to avoid emission crosstalk.
For imaging of SAM8 during seed development, developing siliques from pSAM8::SAM8-mVenus/sam8-1 plants were collected. The seeds were dissected to remove their seed coats and then imaged. For imaging of SAM8 during seed germination, dry seeds were imbibed in glycerin, NaCl or water solutions for 10–20 min, then dissected to remove the seed coats. The embryos were mounted on a slide, covered with a coverslip and immediately imaged under a Nikon AXR with NSPARC confocal microscope system using a 100×/1.45 oil objective.
For imaging of yeast cells, three colonies were streaked on a medium plate and cultured overnight. Before imaging, a colony was resuspended in liquid medium containing either 1.2 M sorbitol or 0.6 M NaCl. The cells were sprayed onto a slide and covered with a coverslip. Imaging was performed on a Zeiss LSM880 confocal laser microscope. GFP was excited at 488 nm and detected at 491–535 nm. Imaging at 35 °C was performed on a Nikon AX R confocal microscope equipped with an Okolab microscope incubator using a 40× 0.95-NA (numerical aperture) objective.
In vitro phase separation assay
For the in vitro phase separation, the solubility tag MBP was removed by TEV protease cleavage. The proteins were diluted to the desired concentrations with the indicated ionic strengths. The protein samples were incubated for 30 min before imaging. For D2O treatment, the same buffer was prepared with heavy water (SIGMA, 151882). To analyse the effect of PEG8000, Dextran 40 and Ficoll 400 on SAM8 phase separation, the indicated concentrations of those crowders were added to the protein samples in 40 mM Tris-HCl, pH 7.4, 150 mM NaCl, and incubated at the indicated temperatures. The protein samples were imaged in a 384-well low-binding microscopy plate (Greiner bio-one, 781090) using a Zeiss LSM880 confocal microscope equipped with a 63×/1.40-NA oil objective. The quantification of mean intensity and droplet sizes and numbers was performed using ImageJ.
Measurement of the electric field
The electric field was measured using Di-4-ANEPPS as previously described34. Briefly, Di-4-ANEPPS (ThermoFisher) was mixed with protein samples with a final concentration of 1 µM before imaging. Confocal fluorescence images were performed on a Nikon AXR confocal microscope equipped with a 100×/1.49-NA objective. The fluorescence was excited at 470 nm and collected at both 535–545 nm and 610–640 nm. The electrical potential of condensates was calculated as the fluorescence ratio of 535–545 nm and 610–640 nm of the same condensate.
Micropolarity measurement
The proteins were mixed in a 1:1 molar ratio with Halo-SBD and incubated overnight at room temperature in 40 mM Tris-HCl and 500 mM NaCl. Unlabelled dye was removed using a PD MidiTrap G-25 desalting column (Cytiva). The labelled protein was then mixed with the unlabelled protein to achieve a labelling ratio of approximately 10% to minimize potential fluorophore-induced artefacts. The mixed protein sample was treated with 1 µM TEV protease to remove the MBP tag and diluted to a final concentration of 5 µM. PEG8000 of a final concentration of 6% was added to the protein sample. An aliquot of 10 μl was transferred to the glass slide with a 500-μm spacer. A cover slip (0.17 mm) was placed on the top of the spacer. The slide was inverted and allowed to settle for 30–60 min before FLIM imaging. FLIM was performed using a Leica STELLARIS 8 FALCON microscope equipped with a pulsed white laser using 63× oil-immersion objective (Leica, HC PL Apo 63×/1.40 oil CS2). The SBD was excited at 448 nm with 10 MHz rate. Fluorescence lifetime fitting and image analysis were performed using LAS X software.
Fluorescence lifetime imaging–Förster resonance energy transfer
Proteins at a final concentration of 2.5 µM were diluted in 384-well microscopy plates and incubated for 30 min before imaging. Fluorescence lifetime imaging–Förster resonance energy transfer (FLIM-FRET) was performed using a Leica TCS SP8 laser-scanning confocal microscope equipped with a 100×/1.40-NA oil-immersion objective. The samples were scanned with a slow speed of 100 Hz with a repetition rate of 80 MHz. mGFP fluorescence was excited at 488 nm and detected at 500–540 nm using the in-built hybrid detector. A time-correlated single-photon counting (TCSPC) system was used to record photon events.
All FLIM data analysis was performed using Leica LAS X FLIM FCS software. The minimum recorded photon count for modelling was 100. The recorded TCSPC photon arrival time histogram showed a multi-exponential decay. Therefore, the photon arrival times were fitted to a double-exponential reconvolution function, allowing the calculation of mean lifetime by intensity weight. A minimum of 30 regions of interest were selected for analysis. The lifetime of each group was calculated.
Phylogenetic analysis of SAM8
To examine the conservation of SAM8, SAM8 homologues were identified in OrthoDB (https://www.orthodb.org/). A total of 143 SAM8 homologues were identified, and 29 of them from representative species were subjected to neighbour-joining tree construction using ClustalW2. The IDRs were predicted using the IUPred2A algorithm (https://iupred2a.elte.hu/).
Fluorescence recovery after photobleaching assay
FRAP of SAM8 condensates was performed on a Nikon AXR confocal microscope system using a 60×/1.42 oil objective. After one acquisition, three regions of interest corresponding to SAM8-mVenus condensates were bleached at 100% laser intensity at 488 nm. Recovery was recorded for every second for a total of 68 s after bleaching. The fluorescence intensity was measured with ImageJ.
Turbidity measurements
SAM8 and its variants were diluted to a final concentration of 2.5 µM in 40 mM Tris-HCl, pH 7.4, 150 mM NaCl, with or without 6% PEG, and transferred into flat-bottom 96-well plates (Corning, 3364). Turbidity of protein samples was measured at 600 nm using VARIOSKAN FLASH (Thermo).
Quantitative RT-PCR
Total RNA was extracted from Arabidopsis seedlings or other tissues using TRIzol reagent (Invitrogen, 15596018). Contaminating DNA was removed using DNase I (Promega, M6101). Reverse transcription was performed by M-MLV reverse transcriptase (Invitrogen, 28025013) using oligo(dT) primer. Quantitative PCR reactions were performed using the Applied Biosystems 7500 Fast with 2×M5 HiPer SYBR Premix EsTaq (Mei5 Biotechnology, MF787-T) in a final volume of 20 μl. Actin or UBC was used as an internal control. The primers used for qPCR are listed in Supplementary Table 3.
Osmotic potential measurement
Vapour-pressure osmometry was performed on the Vapro 5600 (ELITechGroup) system according to the instructions of the manufacturer. The instrument was allowed to equilibrate to ambient temperature overnight, and the reading stability was validated before measurements were performed. Osmometry readings were assessed for solutions of varying composition and confirmed to be normally distributed in the following tests: Anderson–Darling, D’Agostino–Pearson, Shapiro–Wilk and Kolmogorov–Smirnov. For the measurement of osmotic potential in the FLIM-FRET assay, the buffer containing 40 mM Tris-HCl, pH 7.4, 100 mM KCl was used to prepare PEG8000, NaCl, mannitol or Dextran 40 solutions. For measuring osmotic potential in the seedling treatment, a 1/2 MS liquid medium was used to prepare mannitol or PEG solutions. The water potential is calculated by osmolarity × R × T (where R is the gas constant and T is the absolute temperature).
Immunostaining
Immunostaining of Arabidopsis root tip nuclei was performed as described previously11. Briefly, 7-day-old Col-0 seedlings were treated with an isosmotic buffer prepared with H2O or D2O for 15 min and fixed immediately with 4% paraformaldehyde plus 0.1% Triton X-100 in PBS buffer by applying a brief vacuum. Samples were digested with 3% cellulase R-10 and 0.3% Macerozyme R-10 (Yakult Pharmaceutical Industry) at 37 °C for 5–10 min. Root tips were then cut and squashed on a Polysine-coated slide in a drop of PBS buffer. The slide was then blocked with blocking solution (3% bovine serum albumin in PBS buffer) and incubated with primary antibody to Flag (anti-Flag, dilution by 1:2000, Merck, F1804) and secondary antibody Donkey anti-Mouse IgG (H + L) Highly Cross-Adsorbed Secondary Antibody, Alexa Fluor 488 (dilution by 1:800, Invitrogen, A-21202). After secondary antibody incubation, a drop of DAPI Fluoromount-G (Southern Biotech) was added to each slide. The slide was sealed with a coverslip and imaged with a Nikon AXR with NSPARC confocal microscope system using a 100×/1.45 oil objective. Alexa Fluor 488 was excited at 488 nm and detected at 499–550 nm, and DAPI was excited at 405 nm and detected at 429–474 nm.
RNA fluorescence in situ hybridization
RNA fluorescence in situ hybridization (FISH) was performed as previously described57. Roots from 7-day-old Col-0 and sam8-1 seedlings were treated with liquid medium containing 300 mM d-mannitol for 1 h, then fixed in 4% paraformaldehyde for 15 min at room temperature under gentle vacuum. The roots were washed twice with 1× PBS, placed on a slide, and covered with a coverslip. The samples were squashed, flash-frozen for about 5 s in liquid nitrogen, and air-dried at room temperature for 30 min. The samples were then permeabilized in 70% ethanol for 2 h and washed twice with wash buffer (10% formamide, 2× SSC). A volume of 100 μl hybridization buffer (100 mg ml−1 dextran sulfate, 10% formamide, 2× SSC) containing 1 μM 5′-Cy5-dT35 probe was added to each slide and incubated in the dark chamber at 45 °C overnight. After hybridization, the samples were washed twice in wash buffer (10% formamide, 2× SSC), incubated with 100 μl of 10 μg ml−1 DAPI at 37 °C for 1 h in the dark, washed twice with wash buffer (10% formamide, 2x SSC), and imaged by Zeiss LSM880 microscope system using a 100×/1.45 oil objective. The probe sequences used in this study are provided in Supplementary Table 3.
Mass spectrometry and data analysis
Mass spectrometry was performed as described previously18. Briefly, the protein samples were separated by SDS-PAGE and digested in-gel with trypsin (0.5 ng μl−1). The peptides were extracted from gel slices, separated by HPLC, and sprayed into an LTQ Orbitrap Elite System mass spectrometer (Thermo). A database search was performed on the MASCOT server (Matrix Science) against the IPI (International Protein Index) Arabidopsis protein database. The relative amount of each protein was determined by label-free quantification. The 35S::YFP-TurboID/Col-0 data were used as a background control. Proteins with an adjusted P < 0.05 and fold change ≥2 were considered as being enriched by SAM8.
Co-immunoprecipitation
Approximately 5 g of Nicotiana benthamiana leaves co-expressing SAM8-GFP and other Flag-tagged proteins were ground into fine powder in liquid nitrogen. The powder was lysed with 10 ml lysis buffer (20 mM Tris-HCl, pH 7.4, 150 mM NaCl, 4 mM MgCl2, 0.5% NP-40, 5 mM DTT, 1× protease inhibitor cocktail, 1 mM PMSF) at 4 °C for 30 min. After filtration through Miracloth (Millipore, 475855-1RCN) and brief centrifugation, the supernatant was incubated with 10 μl of GFP-Nanoab-Magnetic Beads (LABLEAD, GNA-50-1000) for 30 min at 4 °C. The beads were washed four times with lysis buffer and boiled in SDS loading buffer. The immunoprecipitates were subjected to western blot analyses.
Western blot analysis
Protein samples were resolved by SDS-PAGE and transferred to PVDF membranes. Antibodies against GFP (anti-GFP, dilution by 1:7000, 11814460001, Roche) and Flag (anti-Flag, dilution by 1:2000, F1804, Sigma/Merck) were used as primary antibodies. After the primary antibody incubation, horseradish peroxidase (HRP)-conjugated secondary antibodies Goat Anti-Mouse IgG, HRP Conjugated (dilution by 1:10,000, CWBIO, CW0102) were used for protein detection by chemiluminescence (Thermo, 34095).
Bimolecular fluorescence complementation
BiFC assays were performed as described previously58. Briefly, the Agrobacterium cells were resuspended in infiltration buffer (10 mM MgCl2, 10 mM MES, pH 5.7 and 100 μM acetosyringone) to an OD600 of 1.0. The cells containing BiFC pairs were mixed in equal ratios and infiltrated into N. benthamiana leaves. Two days after infiltration, N. benthamiana leaves were imaged under a Zeiss 880 confocal microscope. The whole procedure was repeated independently at least three times.
Ribo-seq, RNA-seq and data analysis
Ten-day-old seedlings were treated with or without 300 mM d-mannitol for 1 h and divided into two groups for Ribo-seq and RNA sequencing (RNA-seq) analysis, respectively. For mRNA-seq, total RNA was purified with oligodT-beads to obtain polyA+ mRNAs. RNA-seq libraries were constructed using the NEXTflex RNA-Seq Kit (Bioo Scientific). Briefly, RNAs were fragmented and reverse-transcribed to produce the first and second strands of cDNA. The cDNA was purified and ligated with DNA adapters. The ligated DNA was used as a template for PCR amplification using primers specific to adaptors. The resulting PCR products were purified using AMPure XP beads and sequenced on the Illumina NovaSeq 6000. Raw sequencing data were filtered by fastp20 (v.0.19.7) to remove low-quality reads (reads with more than 50% nucleotides having a phred score ≤5, or reads with more than 10% unmapped nucleotides). The cleaned reads were mapped to the TAIR10 reference genome using HISAT2 (v.2.2.1). Read pairs were assigned to CDS of TAIR10 genes using featureCounts (v.2.0.6). Differential gene expression analysis was performed using the DESeq2 R package (v.1.42.0).
For Ribo-seq, samples were fast-frozen and ground in liquid nitrogen. The resulting fine powder was resuspended in lysis buffer (20 mM Tris-HCl pH 7.4, 150 mM NaCl, 5 mM MgCl2, 1 mM DTT, 100 μg ml−1 cyclohexane, 1% Triton X-100, 25 U ml−1 DNase I). The lysate was treated with nonspecific endoribonuclease RNase I. Isolation of monosomes was performed by size-exclusion chromatography with MicroSpin S-400 HR columns (Cytiva, 27-5140-01). Ribosome-protected fragments (RPFs) were isolated from monosome fractions and subjected to rRNA depletion using QIAseq FastSelect –rRNA Plant Kit (Qiagen, 334315). Following PAGE purification, both ends of RPFs were phosphorylated and ligated with 5′ and 3′ adapters, respectively. The purified RNA fragments were reverse-transcribed into cDNAs and amplified by PCR. After library construction using NEBNext Multiplex Small RNA Library Prep Set for Illumina (Set 1) (NEB, E7300S), the concentration of DNA was measured by Qubit 2.0 Fluorometer and adjusted to 1 ng μl−1. After quality control of the insert size and concentration using Agilent 2100 Bioanalyzer and quantitative PCR, the library was sequenced on the Illumina platform.
For Ribo-seq data analysis, low-quality reads were filtered by in-house scripts. Reads mapped to rRNA and tRNA by Bowtie (v.1.1.2) were discarded. Cleaned reads were mapped to the TAIR10 genome using TopHat2 (v.2.0.12). Mapped reads were assigned to CDS of TAIR10 genes using HTSeq (v.0.9.1). The fold changes of RPFs were determined by edgeR25 (v.3.24.3) using the quasi-likelihood method. TE was calculated as the ratio of Ribo FPKM to total mRNA RPKM. Genes with a 1.2-fold change and a P < 0.05 were identified as significantly changed genes. The clusterProfiler (v.4.8.1) was used for functional enrichment analyses in NovoMagic.
Polysomal profiling and analysis
Polysome profiling was performed as previously described59 with minor modifications. Five-day-old seedlings (about 0.2 g per sample) were treated with or without 0.3 M Mannitol for 1 h, ground into fine powder in liquid nitrogen, homogenized in 0.8 ml pre-chilled polysome extraction buffer [200 mM Tris-HCl, pH 9.0, 200 mM KCl, 35 mM MgCl2, 25 mM EGTA, 1% sodium deoxycholate, 1% detergent mix (20% Briji, 20% Triton X-100, 20% Igepal CA630, 20% Tween 20), 1% polyoxyethylene 10 tridecyl ether (PTE), 5 mM DTT, 1 mM PMSF, 50 μg ml−1 cycloheximide, 50 μg ml−1 chloramphenicol, and 100 U ml−1 RNasin ribonuclease inhibitor (Promega)], and incubated on ice for 20 min. The resulting slurry was centrifuged at 13,000 rpm, 4 °C for 15 min. A total of 100 μl of the resulting supernatant was saved for total mRNA isolation. Another 700 μl was loaded on top of a pre-chilled 10–50% sucrose gradient (10× sucrose salt buffer: 400 mM Tris-HCl, pH 8.4, 200 mM KCl, 100 mM MgCl2) and centrifuged in a Beckman SW41Ti rotor at 33,500 rpm for 3 h at 4 °C. The absorbance of separated subunits, monosomes and polysomes was detected at UV260, and 14 fractions were collected using a gradient fractionator (Biocomp). Polysomal RNAs were isolated from the mixed polysomal fractions (fractions 9–14) using the TRIzol/chloroform method. The translational efficiency was calculated as the ratio of RNA level in polysomal fractions compared with total transcripts by quantitative RT-PCR.
Statistics
Statistical analysis was performed using either an unpaired two-tailed Student’s t-test or a one-way analysis of variance, followed by the least significant difference test. For the statistical significance of the interaction between two factors, Shapiro–Wilk and Levene’s tests were used to assess normality and homogeneity, respectively. A two-way analysis of variance with Tukey’s post hoc analysis was performed (α = 0.05). Statistical details of experiments are specified in the figure legends. The fluorescence intensity was measured with ImageJ. All statistical analyses were performed in IBM SPSS Statistics v.19.
Reporting summary
Further information on research design is available in the Nature Portfolio Reporting Summary linked to this article.

