


Animals and housing
Long-term laboratory colonies of naked mole-rats (H. glaber) were maintained in Berlin, Germany and Pretoria, South Africa. Damaraland mole-rat (F. damarensis) colonies were maintained in Pretoria, and Micklem’s mole-rat (Fukomys micklemi), Mashona mole-rat (Fukomys darlingi) and Mechow’s mole-rat (Fukomys mechowii) were maintained in České Budějovice, Czech Republic. (The following species were kept in the laboratory (Pretoria, South Africa) for unrelated studies after being collected from the wild: Highveld mole-rat (Cryptomys hottentotus pretoriae), Natal mole-rat (Cryptomys hottentotus natalensis), common mole-rat (Cryptomys hottentotus hottentotus), Cape mole-rat (G. capensis), Cape dune mole-rat (B. suillus), and Emin’s mole-rat (H. emini).
In Berlin, naked mole-rats were kept under controlled environmental conditions, with ambient temperature kept at 30–32 °C and humidity at 50–70%, under dim illumination. Eighteen colonies were housed in custom-designed, interconnected plastic chamber systems (Fräntzel Kunststoffe). Animals were provided with a daily ad libitum diet of tubers (primarily sweet potatoes, celery root, cucumbers, bananas and carrots) and supplemented weekly with ProNutro (Bokomo). All husbandry and experimental procedures were approved by the local governmental authorities in Berlin (Landesamt für Gesundheit und Soziales, licenses G 0196/17 and G 0121/23). When selecting animals for experiments, a non-invasive salivary swab assay was established to determine sex by genotyping. In brief, saliva was collected from live naked mole-rats using a swab (Geyer). The extraction of genomic DNA was performed with proteinase K. Precipitation of the DNA was performed to concentrate the DNA solution used as template for the PCR. To determine whether the animal is a male, we amplified a 163-bp region of the sex-determining gene on the Y chromosome, Sry using Hg-SRY-For 5′-GAAGAACGGCCATTTTTCGG-3′ Hg-SRY-Rev 5′-GCATTCATGGTGTGGTCTCG-3′.
To check the DNA quality and PCR condition, we amplified a 446-bp region of the mitochondrial 16S rRNA gene using Hg-16S-For, 5′-TGGTGATAGCTGGTTGTCCA-3′ and Hg-16S-Rev, 5′-TAGTCTTTCCTTGCGGCACT-3′, amplicon detectable in both sexes as previously described57.
In South Africa, eight colonies of naked mole-rats were maintained in tunnel systems consisting of multiple plastic chambers (designated for food storage, toileting and nesting) connected by acrylic glass tunnels. Animals were fed a varied diet of chopped vegetables (primarily sweet potatoes, cucumbers and carrots) with weekly ProNutro supplementation. Nesting material consisted of wood shavings. The holding rooms were kept at 29–32 °C with 50–70% relative humidity.
In the Czech Republic, the animal rooms of Micklem’s mole-rat, Mashona mole-rat and Mechow’s mole-rat were kept at 25 ± 1 °C, 50 ± 10% relative humidity and photoperiod of 12 h light:12 h dark. Animals were fed ad libitum with vegetables (such as carrots, potatoes, sweet potatoes, beetroot, apple and cucumbers) and a rodent dry food mix. Animals were given the opportunity to carry out their natural digging behaviours in peat and were provided extra enrichment such as tree branches and plastic tubes for gnawing.
All procedures were approved by the relevant institutional animal care and use committees and local governmental authorities in Berlin (Max Delbrück Center; Landesamt für Gesundheit und Soziales, licenses G 0196/17 and G 0121/23) and Pretoria (University of Pretoria), in accordance with national and international guidelines for the ethical treatment of laboratory animals. Procedures in Pretoria were approved by the Animal Ethics Committee of the University of Pretoria (license no. NAS199/2020, NAS071-2023, NAS313/2022, NAS324/2022, NAS209-2021, NAS011/2025 and NAS130_2025) and received DALRRD Section 20 approval (SEpi-Bizhub24110620262, SDAH-Epi-22101309360, SDAH-Epi-23032315040, SDAH-Epi-23041710040, 12/11/1/1/8 (2002 LH), SEpi-Bizhub25021311032 and SEpi-Bizhub25061009490). All naked mole-rats used in this study were derived from colonies originally captured by J. Jarvis, primarily in Mtito Andei and Lerata, Kenya, and represent a mixed parentage1.
Behavioural assays
Social rank determination
To assess dominance hierarchies within the eight colonies from South Africa, we followed a previously established assay for naked mole-rat social rank22,58. In brief, two plastic chambers were connected by a transparent tube, with one animal placed in each chamber. When both entered the tube simultaneously, the individual climbing over the other was scored as dominant. Each dyad was tested in at least three trials, with pairings pseudo-randomized and repeated across multiple months. A ranking index (R.I.) was calculated as wins divided by total trials and normalized to the colony maximum (R.I. = 1 for the top-ranking individual). Ranks were assigned categorically (rank 1: R.I. > 0.8, rank 5: R.I. < 0.2). For experiments, we used high-ranking individuals with R.I. ≥ 0.7 and low-ranking individuals with R.I. ≤ 0.3.
Social recognition and sniffing discrimination
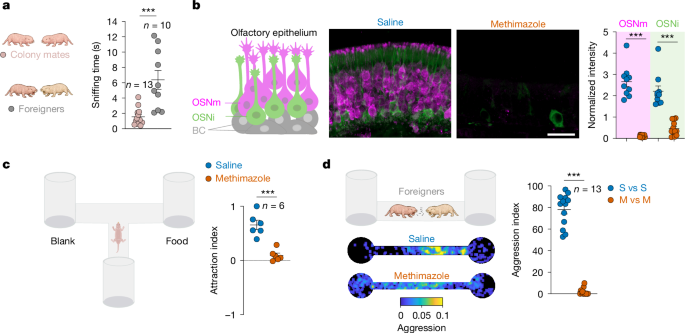
Pairs of naked mole-rats were introduced into transparent acrylic tubes and video-recorded with a high-speed camera (BASLER, boA1936-400cm) at 100 frames per second for 5 min. Sniffing bouts, characterized by rhythmic nose movements and defined as nose-to-body contact, were scored by an observer blind to colony identity. Each dot represents one animal-pair interaction.
Aggression assays
Animals from seven colonies from South Africa were paired and introduced into a rectangular arena (60 cm × 7 cm). Aggressive interactions—including head-to-head lunges, shoves and bites—were video-recorded, and head-to-head positions (distances <4 cm) were analysed using a custom-written MATLAB script in combination with DeepLabCut59. All frames were subsequently checked by human observers, and any errors were corrected to ensure accurate position identification. Recordings lasted 5 min or were terminated earlier if there was a risk of severe injury. An aggression index was calculated as the proportion of time an animal engaged in aggressive behaviours relative to the total assay duration. Spatial distributions of head-to-head encounters were visualized as heat maps. Higher-ranking individuals, previously identified to defend their colonies in observations across these seven colonies, were used.
T-maze odour preference assay
Odour-guided attraction was tested in a two-choice T-tube olfactometer. The apparatus comprised a start chamber (30 cm × 20 cm × 14 cm) connected to 2 entrance tunnels (64 cm × 7 cm), which extended into side tunnels (80 cm × 7 cm) leading to either a control or a stimulus chamber (30 cm × 20 × 14 cm). In the food odour assay, one arm was scented with ProNutro (cereal-based supplement) food odour (odour source placed outside the maze to prevent contact), whereas the opposite arm contained no odour. In the IPM preference assay, bedding was treated with IPM diluted in DMSO (in total 50 µl; 8.5 µg) in one arm and 50 µl DMSO as a solvent control in the other. Animals were placed in the start chamber and allowed to explore freely for 10 min. Position and movement trajectories were recorded using a custom-written MATLAB script in combination with DeepLabCut59. Attraction indices were calculated as (time in odour arm – time in control arm)/total assay time. To control for side bias, the odour-stimulus arm was alternated between replicates.
Maze exploration
Individuals were placed in a novel multi-arm maze (80 cm × 7 cm, 4 arms) and video-recorded for 15 min. Animal trajectories were quantified and total coverage was calculated.
Pregnancy-suppression assay
Opposite-sex pairs were formed from low-ranking non-breeders, matched for body size and drawn from the same colonies to avoid confounds related to isolation history, and were housed in three chambers (30 cm × 20 cm × 14 cm) connected by two tunnels (64 cm × 7 cm). Pairs were randomly assigned to blank bedding (n = 6), bedding supplemented with toilet bedding from their original colony (n = 6), or bedding treated daily with IPM (n = 7; 500 µl applied to bedding, equivalent to 425 mg; see Extended Data Fig. 3c,d for time-dependent decay of IPM). Because testes in naked mole-rats remain intra-abdominal, external genital morphology was used only as a qualitative indicator and not as a quantitative measure of gonadal activation. Animals were monitored for 18 weeks, during which pregnancy status, body weight, genital morphology, vaginal perforation and reproductive activation were assessed; reproductive activation was assessed using endocrine measures and qualitative external genital observations, including vaginal perforation, which were documented photographically. Pregnancy was defined by progressive body mass gain of ~20–30 g beginning at weeks 3–9 and continuing until weeks 15–18. In the blank group (3 replicates in Berlin, 3 in Pretoria), 5 of 6 females gained body mass and gave birth, whereas none of the females in the colony bedding (3 Berlin, 3 Pretoria) or IPM groups (3 Berlin with 500 µl isopropyl myristate + 500 µl DMSO, 4 Pretoria with 500 µl neat isopropyl myristate; both delivering ~425 mg IPM) became pregnant and body masses remained stable. Pregnancy outcomes were interpreted as a downstream consequence of reproductive activation and were evaluated alongside longitudinal endocrine measures and body mass trajectories. Males showed no significant body mass changes in any group.
Queen removal and colony stability
Three weeks after blood collection from an intact colony, the queen was removed from an intact colony that consisted of 19 individuals (8 females and 11 males) to initiate destabilization, after which IPM (500 µl equal to 425 mg; see Extended Data Fig. 3d for time-dependent decay of IPM) was applied daily to the bedding for 12 weeks to simulate persistent queen-derived olfactory cues. The colony was inspected daily, and behavioural interactions were scored. Blood samples were collected at weeks 0, 15, 19 and 34 by tail venipuncture, and plasma was stored at –80 °C until analysis. Prolactin concentrations were measured as described below. Body masses of all females were measured weekly using a precision balance (Scout Pro SPU123, Ohaus).
Odour collection and chemical analyses
Volatile compounds were collected by placing individual naked mole-rats in a Plexiglas chamber (30 cm × 20 cm × 14 cm) for 30 min, during which headspace odours were adsorbed onto PDMS tubes suspended from the chamber lid. PDMS tubing (1 mm internal diameter × 0.4 mm wall thickness; VWR International) was cut into 1-cm segments, soaked in 100% methanol for up to 24 h, and conditioned under a constant flow of purified nitrogen at 180 °C for 1.5 h in a modified heating oven. Odour samples were collected from non-breeding males, non-breeding females, breeding males, and queens across reproductive states (pre-mating, mating, pregnancy and lactation (n = 3 for each)). Ovulation was inferred retrospectively using established reproductive staging in naked mole-rats, based on longitudinal behavioural observations, and defined reproductive states (pre-mating, mating, pregnancy, and lactation). As direct determination of the ovulatory window was not feasible, this classification reflects inferred reproductive state rather than precise measurement of ovulation. Additional samples were non-invasively obtained from eight African mole-rat species, and in naked mole-rat queens, swabs were taken from vaginal, anal, oral, teat, and skin regions using PDMS tubes on the same day.
Breeding females of the four Fukomys spp. were sampled across two reproductive stages (ovulation and pregnancy), as were naked mole-rats. The three Cryptomys spp. females were likewise sampled during ovulation and pregnancy, whereas Bathyergus females were sampled during lactation. We could not identify the reproductive stage of G. capensis. Importantly, IPM was detectable across all sampled reproductive stages (Fig. 2g), but its abundance was most strongly elevated during ovulation, indicating that the observed species differences are not attributable to mismatched reproductive staging. Reproductive state in all breeding females was retrospectively determined using established morphological and behavioural criteria.
All samples were analysed by TD-GC–MS as previously described23 with minor modifications. In brief, analyses were performed on an Agilent 7890A GC system coupled to a 5975C inert XL MSD and fitted with an HP5-MS UI column (19091S-433UI; Agilent Technologies). Following desorption at 250 °C for 3 min, volatiles were cryo-trapped at −50 °C with liquid nitrogen and transferred to the GC column via a vaporizer injector heated to 270 °C (12 °C s−1, 5-min hold). The GC oven program was: 40 °C for 3 min, ramped at 5 °C min−1 to 260 °C (10-min hold), then 5 °C min−1 to 280 °C (5-min hold). Mass spectrometry parameters were: transfer line 260 °C, ion source 230 °C, quadrupole 150 °C. Compounds were ionized by electron impact (70 eV), detected in positive ion mode (m/z 33–500), and identified using NIST spectral libraries. XCMS (v3.7.1) was used to analyse and compare odour profiles. The identity of IPM was confirmed by comparison of mass spectra and retention time with a commercial standard (Sigma-Aldrich, 172472).
Calibration of IPM on PDMS tubes
To generate a calibration curve, defined amounts of IPM (1 µl of 8.5 ng, 850 ng, 85 µg, and 850 µg; Sigma-Aldrich) were applied directly onto conditioned PDMS tubes (1 cm × 0.3 cm). After solvent evaporation, tubes were analysed using TD-GC–MS (Agilent 7890 A/5975 C, equipped with an HP-5MS UI column). Peak areas of the IPM chromatographic signal were quantified and log10-transformed. A linear regression of log10(peak area) versus log10(mass) was fitted (Y = 0.6016 × X + 8.656). The mean peak area measured from queen samples was converted to mass equivalents using this calibration, corresponding to 660 ± 80 ng IPM (mean ± s.d., n = 4–7).
Time-course decay of IPM in a chamber
For breeding and queen-removal experiments, we examined the temporal dynamics of volatilized IPM, 500 µl (425 mg) of neat IPM was placed on the floor of a sealed Plexiglas chamber (30 cm × 20 cm × 14 cm). PDMS tubes were suspended from the chamber lid and collected volatiles at defined timepoints (0, 6, 12, 18 and 24 h). Tubes were analysed by TD-GC–MS as described above. Peak areas were log10-transformed and plotted against time, revealing a progressive decline in IPM signal. Linear regression yielded Y = –0.05602 × X + 8.827. The average queen IPM level corresponded to the concentration present at 5.2 ± 0.75 h after application (n = 4).
Methimazole-induced olfactory ablation
Methimazole (Sigma-Aldrich; M8506) was diluted in 0.9% NaCl and administered by intraperitoneal injection at 75 mg kg−1. Following methimazole injury, the olfactory epithelium in mice regenerates over approximately 1 month, with newly generated OSNs beginning to establish synaptic contacts with the olfactory bulb within ~1–2 weeks (ref. 60). Accordingly, all behavioural experiments were conducted within 3–7 days post-injection, the established window of maximal OSN loss, ensuring effective olfactory ablation. Control animals received sterile saline only. After 72 h, olfactory epithelium was collected for histological analysis as described18. In brief, animals were perfused, and tissue was fixed in 4% paraformaldehyde (PFA), embedded in OCT, cryosectioned at 60 µm, and immunostained with antibodies against OMP (mature OSNs; goat polyclonal, 1:1,000; Wako Chemicals, 544-10001) and STMN1 (immature OSNs; rabbit polyclonal, 1:500; Abcam, ab24445). Images were acquired using an Airyscan confocal fluorescence microscope (Axio, Zeiss) with a 20× objective. Exposure parameters were kept constant across sections, and identical contrast adjustments were applied to all images. Mean fluorescence intensity was quantified using ImageJ61.
Electro-olfactogram recordings
Recordings were performed as previously described62 with minor modifications. Animals were deeply anaesthetized with an overdose of ketamine and xylazine (100 and 20 mg kg−1, respectively) and subsequently decapitated. Heads were bisected along the sagittal midline and immediately transferred to a dissecting microscope, where the olfactory epithelium was surgically exposed. Extracellular activity from OSNs was recorded using a tungsten wire electrode inserted into the olfactory mucosa. For stimulus delivery, 10 μl of freshly prepared odorant solution was applied to a 1 cm2 piece of filter paper (Whatman) and inserted into a glass Pasteur pipette. Odour stimuli (1 s air puffs) of IPM (1:10 dilution in DMSO; equal to 85 µg µl−1) or DMSO alone were delivered at a controlled flow rate of 40 cm s−1 (Stimulus Controller CS 55, Ockenfels-Syntech). Signals were amplified at a sampling rate of 10 kHz, low-pass filtered at 50 Hz using a NeuroLog Amplifier (Digitimer), and recorded with a PowerLab 4/30 system (ADInstruments) running LabChart 8 software for subsequent analysis.
Whole-brain FOS imaging
Animals were exposed to IPM (500 µl, equivalent to 425 mg) or solvent for 90 min in a Plexiglas chamber (30 cm × 20 cm × 14 cm). At the end of exposure time, animals were deeply anaesthetized with an intraperitoneal single-dose injection of ketamine and xylazine (100 and 20 mg kg−1, respectively), transcardially perfused with phosphate-buffered saline (PBS) followed by 4% PFA. Whole-brain tissue was collected, incubated with 4% PFA overnight at 4 °C and then transferred to 0.02% sodium azide in PBS for storage until clearing. One brain was excluded from the FOS analysis because unsuccessful perfusion compromised tissue quality and prevented reliable quantification. All other samples were processed according to the LifeCanvas Technologies protocol (v5.03, based on63) in the following order: SHIELD preservation, Delipidation with SmartClear II Pro, Immunolabelling with SmartLabel. Cleared brains were incubated with 3.5 μg of rabbit anti-FOS monoclonal antibody (Abcam, ab214672) together with 24 μl of propidium iodide (Thermo Fisher, P3566, 1.0 mg ml−1 solution in water) for nuclear stain. Primary antibody against FOS was fluorescently conjugated (Alexa Fluor® 647) with a donkey anti-rabbit secondary antibody (Jackson ImmunoResearch, 711-605-152) in 1:1.5 primary:secondary molar ratio. After active labelling, samples were matched to a refractive index of n = 1.52 using EasyIndex (LifeCanvas Technologies). Two datasets were generated, each containing equal numbers of animals from both treatment conditions. The first dataset (n = 4) was processed as described above and imaged with a custom built mesoSPIM29 light-sheet fluorescence microscope using 4× magnification. Pixel size was 1.6 µm for nominal lateral spatial resolution with a 6 µm step size in the z-direction. 488, 561 and 647 nm excitation was used with the respective 520/50, 590/50 and quad band 405/488/561/640 nm emission filters to image the entire brain for autofluorescence background, nuclear stain and FOS signal. The second dataset (n = 2) was sent to LifeCanvas Technologies where samples were passively delipidated for 7 days, batch labelled using SmartBatch+ with donkey anti-rabbit SeTau647 secondary antibody (LifeCanvas Technologies, DkxRb-ST), and imaged with SmartSPIM using a 3.6× objective. Pixel size was 1.8 μm laterally with a 4 μm z-step. Laser excitation at 561 nm and 640 nm was used with 600/50 and 690/50 emission filters to image nuclear stain and FOS signal. All samples in each dataset were imaged using the same imaging protocol and excitation intensities.
Whole-brain image processing and analysis
FOS+ neurons in the olfactory bulb were quantified using a difference-of-Gaussian filter and local maxima detection implemented in Matlab 2023b (Mathworks). Whole-brain images were stitched and reconstructed using BigStitcher and Fiji64,65. All analyses were performed blinded to treatment conditions.
To enable quantitative comparison of FOS-positive cell densities acquired using different light-sheet microscopes, we assessed and matched the effective spatial resolution of mesoSPIM and SmartSPIM datasets. Intensity profiles along the axial (z) dimension were extracted from individual FOS-positive cells and fitted with Gaussian functions to estimate the axial point spread function (PSF). SmartSPIM data exhibited substantially higher axial resolution than mesoSPIM. To harmonize resolution, SmartSPIM image stacks were filtered with a 3D Gaussian kernel (σ = 1, 1 and 2 pixels in x, y and z, respectively), preserving lateral resolution while increasing axial spread to match that of the mesoSPIM. Filtered SmartSPIM datasets were then resampled to the mesoSPIM voxel size prior to downstream cell counting and density analyses. Importantly, filtering parameters were derived solely from single-cell PSF measurements and were independent of cell counts.
The total volume of the olfactory bulb from which FOS-positive cells were quantified was estimated by manually thresholding the light-sheet fluorescence imaging data. The threshold was selected to include all visible olfactory bulb tissue while excluding background signal. The number of voxels exceeding this threshold was multiplied by the voxel volume to obtain the total sampled volume. FOS+ cell density was calculated as the number of FOS-positive cells divided by the total sampled olfactory bulb volume (cells per mm3).
fUSI experiment
Plane wave fUSI was performed using an Iconeus One ultrafast ultrasound system (Iconeus) equipped with a 15-MHz IcoPrime 4D MultiArray probe. Whole-brain volumes were acquired by scanning 40 coronal planes with a slice spacing of 0.21 mm, using the manufacturer’s default ultrafast plane-wave sequence. Experiments were performed in naked mole-rats aged 1–3 years with body weights not exceeding 40 g. Animals were anaesthetized with ketamine (100 mg kg−1) and xylazine (2 mg kg−1) and secured in a stereotaxic frame. Rectal body temperature was maintained at 29.5 °C using a heating pad placed beneath the animal. Odour delivery was controlled by a stimulus controller (CS 55, Ockenfels-Syntech) connected to a glass tube, from which gas was released at the distal end (2 mm diameter). The glass tube was positioned in front of the anterior nostrils to allow efficient delivery of odorants into the nasal cavity. Each imaging session lasted 6 min and followed an off–on stimulation paradigm consisting of alternating 30-s stimulation and 30-s rest periods.
Signal analysis of fUSI data
Although no anatomical atlas is currently available for the adult naked mole-rat, we found that overall brain size and major vascular architecture resemble those of the mouse. Therefore, imaging data were registered to the Allen Mouse Brain Atlas66. Following an initial anatomical registration using Iconeus’ proprietary Brain Positioning System (BPS)67, a second, animal-specific registration step was performed. For each animal, a randomly selected imaging session was chosen as a reference, and all remaining acquisitions from that animal were registered to this reference session, thereby inheriting the transformation matrix linking the data to atlas space. Registration was conducted in two stages—coarse and fine—using custom Python code implemented with SimpleITK registration utilities and methods68.
First-level event-based analysis with generalized linear modelling
As previously described, olfactory stimulation was performed using a single event-based experimental design. For statistical analysis, we used previously developed custom code69 that adapts a generalized linear model framework70 from fMRI Python packages71 for fUSI data. Power Doppler images were first spatially smoothed using a Gaussian kernel (full width at half maximum, 300 µm). A design matrix was then constructed incorporating the stimulus paradigm, cosine drift regressors, and data-driven confounding regressors. The stimulus pattern was convolved with a previously described hemodynamic response function72. Cosine drift terms were computed up to 0.01 Hz based on the power Doppler acquisition frequency (1/6 Hz). Data-driven confounds were estimated using aCompCor73 by extracting the first three principal components of the Power Doppler signal from white matter and cerebrospinal fluid voxels. Using a first-order autoregressive model74, a generalized linear model was fitted for all imaging sessions in a given pair of animal and experimental condition (for IPM, DMSO (negative control), ethanol (positive control) and, when available, air olfactory stimulation). z-score maps were derived from model effect sizes using stimulus-specific contrast matrices. Statistical thresholds were determined using the Benjamini–Hochberg procedure for false discovery rate correction (α = 0.01), and voxels not forming 6-connected clusters of at least 30 voxels above threshold were excluded. Finally, prominent clusters in thresholded IPM z-maps were identified, and spherical regions of interest (r ≈ 400 µm) were defined around the voxel exhibiting the maximal z-score.
rCBV in the piriform cortex
Following cluster detection in the z-score maps, one spherical mask per animal (n = 4) was selected to encompass a prominent activation cluster located within or adjacent to the piriform cortex. For each animal, power Doppler time series were extracted from all voxels within the corresponding mask for each experimental condition (IPM, DMSO and air). For each imaging session within a given condition, rCBV signals were obtained by regressing out previously computed data-driven aCompCor confounds from the extracted power Doppler time series using QR decomposition, followed by standardization of the residual signals as percent change relative to baseline. The baseline was defined as the first OFF period of the stimulation paradigm and the second half of subsequent OFF periods. For each rCBV time series, the average stimulus-evoked response was computed by windowing the stimulus ON period, padded at both onset and offset by half of the OFF period, and then averaging these windows across imaging sessions for each experimental condition.
Bootstrap and permutation testing
Permutation testing75 was performed separately for each animal to compare rCBV responses between pairs of experimental conditions. For each voxel within the spherical mask, the mean trapezoidal AUC of the rCBV signal was calculated over the stimulus ON period. The difference between mean AUC values for condition A (for example, IPM) and condition B (for example, DMSO) was then computed. Effect sizes and 99% confidence intervals were estimated using 5,000 permutation resamples, in which voxels were randomly reassigned to conditions A or B with replacement. Permutation testing was implemented using the DABEST Python package76.
Plasma collection and prolactin measurement
Adult naked mole-rats were removed from their natal tunnel systems and weighed. Venous blood samples, corresponding to ~1% of the animal’s body mass were collected from the tail vein using heparinized micro-haematocrit tubes and transferred into Eppendorf tubes. Samples were centrifuged immediately at 500g, and the resulting plasma was decanted and stored at −80 °C until analysis. Plasma prolactin concentrations were quantified using a commercial enzyme-linked immunosorbent assay (ELISA; Elabscience, guinea pig prolactin kit, E-EL-GP0358) following the manufacturer’s protocol. This assay has been previously validated for naked mole-rats38. The intra-assay coefficient of variation was <10%, and assay sensitivity was 0.09 ng ml−1.
Faecal sample collection
The opposite-sex pairs experiments were conducted across two locations (as stated above). Faecal hormone analyses were performed only on samples collected in South Africa (n = 3 pairs). Faecal samples were collected opportunistically during routine animal management procedures, including scheduled weighing and blood sampling events. Samples were collected immediately after defecation to avoid environmental contamination, transferred into sterile containers using sterilized forceps, and stored frozen until further processing.
Faecal steroid extraction
Faecal samples were freeze-dried and homogenized to a fine powder following established protocols42. Depending on sample mass (0.0150–0.0249 g, 0.0250–0.0366 g and 0.0370–0.0550 g), steroids were extracted using 0.5, 1.0 or 1.5 ml of 80% ethanol, respectively. Samples were vortexed for 15 min, centrifuged at 1,500g for 10 min, and the resulting supernatant was transferred into microcentrifuge tubes77. Extracts were stored at −20 °C until hormone analysis.
Quantification of faecal androgen and progestagen metabolites
Faecal androgen metabolites and faecal progestagen metabolites were quantified using enzyme immunoassays (EIAs) for epiandrosterone78 and 5α-tetrahydroprogesterone79, respectively. These assays have been validated for use in naked mole-rats and shown to reliably reflect reproductive endocrine activity80. It should be noted that faecal steroid metabolites reflect circulating hormone changes with a physiological delay, as they represent metabolized hormone excretion rather than real-time endocrine levels.
Hormone quantification followed established protocols81. Assay sensitivities were 6.0 ng g−1 faecal dry mass for the 5α-tetrahydroprogesterone EIA and 7.2 ng g−1 faecal dry mass for the epiandrosterone EIA. Intra-assay coefficients of variation were 4.38% and 5.32% for the 5α-tetrahydroprogesterone EIA and 7.40% and 7.94% for the epiandrosterone EIA. Inter-assay coefficients of variation for the 5α-tetrahydroprogesterone EIA were 11.10% and 12.75%. Only a single plate was used for the epiandrosterone EIA; therefore, inter-assay variation was not calculated.
Human odorant receptor screening and luminescence assay
HEK-293 cells (RRID:CVCL_0045), a human embryonic kidney cell line, were used as a heterologous system for recombinant olfactory receptor expression. Cells were maintained at 37 °C in a humidified incubator (5% CO2) in DMEM supplemented with 4.5 g l−1 d-glucose, 10% fetal bovine serum, 2 mM l-glutamine, 100 U ml−1 penicillin and 100 μg ml−1 streptomycin. Luminescence-based functional assays were performed as previously described35. For receptor screening, a cDNA expression plasmid library comprising 766 constructs, encoding 386 human odorant receptor reference sequences and 380 common variants, was transfected into HEK-293 cells.
cAMP-dependent luminescence signals were acquired using a GloMax Discover detection system (Promega) and analysed in Excel (Microsoft, v16.109.2). Raw traces were averaged, and basal activity was subtracted from odorant-induced responses. For concentration–response relationships, baseline-corrected values were normalized to the maximal response of a reference odorant receptor–odorant pair, and signals from mock-transfected controls were subtracted. Dose–response curves and half-maximal effective concentration (EC50) values were determined by nonlinear regression (SigmaPlot 14.0, Systat Software) using the equation f(x) = (min – max)/(1 + (x/EC50)Hillslope)+max, with Hill slope constrained to ≤2.9 and data points weighted by the reciprocal of their standard deviation (0.1/s.d.). Dose–response curves were fitted using nonlinear regression (log[agonist] versus response, variable slope).
Phylogenomic analysis
Protein-coding transcripts from ten African mole-rat species (H. glaber, H. emini, G. capensis, F. damarensis, F. micklemi, F. darlingi, F. mechowii, C. hottentotus, C. natalensis and C. pretoriae) were combined with transcripts obtained from published data82 and from a newly assembled transcriptome of B. suillus. Following previous methodology82, orthologous datasets were cleaned, resulting in a set of 3,393 single-copy genes (SCGs) shared across all 11 species. These genes were aligned using the mafft-linsi algorithm implemented in MAFFT83, and alignments were further trimmed to remove columns containing gaps in more than 50% of the species. Orthofinder84 was used to discover orthogroups and build a species tree from the SCGs. Maximum-likelihood gene trees and species trees were inferred using default settings (-m MSA) based on the individual gene trees. For divergence time estimation, the species tree was calibrated with the TimeTree R package85, constraining the split between M. musculus and Bathyergidae to 56–77 million years ago.
Statistics and figure preparation
Sample sizes were chosen on the basis of feasibility, ethical considerations and consistency with prior studies in naked mole-rats and other mole-rats, as well as established practice for behavioural, endocrine, imaging and electrophysiological experiments in this field. No statistical methods were used to predetermine sample size. Where possible, multiple independent animals, colonies or experimental repetitions were used. Opposite-sex pairs in the pregnancy-suppression assay were randomly assigned to blank bedding, natal colony bedding or IPM. Other groups were defined by social/reproductive status or colony manipulation, so randomization was not applicable. Behavioural and FOS analyses were performed and scored by observers blinded to treatment. Blinding was not applicable where groups were defined by social or reproductive status or by chemical or colony treatment. Normality was first assessed on datasets using a Shapiro–Wilk test. Statistical analyses (see the corresponding legends of each figure) and figures were generated using GraphPad Prism v8 (https://www.graphpad.com) and further processed with Adobe Illustrator v25.2.1.
Reporting summary
Further information on research design is available in the Nature Portfolio Reporting Summary linked to this article.

