


Materials
PE (Mn = 1,700 Da, Mw = 4,700 Da by GPC) was purchased from Sigma-Aldrich. PP (Mn = 5,000 Da), UHMWPE (Mn = 6,000,000 Da) and 3,3′,5,5′-TMB were purchased from Macklin. (Trimethylsilyl)diazomethane (TMS-CHN2), PBD and all of the standard diacids were purchased from Aladdin. 4-Carboxyphenylboronic acid (4-CPB) was purchased from Shanghai Meryer Scientific. CH3OH (as received), ether (as received) and 30% H2O2 (as received) were purchased from Sinopharm Chemical Reagent. PS (as received) was purchased from Shanghai Titan Scientific. H218O (97% 18O) was purchased from Shanghai Xinbo Industrial. Deionized water with the specific resistance of 18.2 MΩ cm was used in all experiments.
Characterization
The molecular weight of the polymers was recorded using an Agilent PL-GPC 220 system. 1,2,4-trichlorobenzene (TCB) was used as mobile phase at 150 °C. High-temperature gel permeation chromatography (HT-GPC) measurements were calibrated using narrow PS standards. The effective calibration range of the system spans approximately 500 to 1 × 10⁷ g mol−1. 1H-NMR, 13C-NMR and HSQC were performed on a Bruker AVANCE III 500. Fourier transform infrared (FT-IR) spectra were recorded on a Nicolet Nexus 470 in the spectral range 400–4,000 cm−1 using the KBr disc method. Ultraviolet–visible (UV–Vis) spectra were recorded on a Hitachi UH5300 in the spectral range 190–1,100 nm. EPR signals were carried out on a Bruker A300 X-band EPR spectrometer. The radical scavenger used was 5,5-dimethylpyrroline-N-oxide (DMPO). The H2O2 concentration was measured by a catalase assay kit (Beyotime Biotech) on a microplate reader (Thermo Fisher Scientific Varioskan LUX). Confocal fluorescence detection was performed on a Zeiss LSM 980 with Airyscan. We conducted thermal analysis using a METTLER-TOLEDO TGA/DSC 1 or an equivalent synchronous thermal analyser. All measurements were performed under a nitrogen atmosphere with a heating rate of 10 K min−1. We carried out proximate analysis using a 5E-MAG6700 Fully Automatic Industrial Analyzer. Before testing, the commercial PE samples were cooled with liquid nitrogen and ground into powder.
Catalyst-free PE oxidation
This one-pot reaction was performed in the Parr autoclave (Anhui CHEMN Instrument) equipped with an electronic pressure gauge. PE (0.2 g) and 5 ml of deionized water were loaded into the autoclave. The sealed reactor was purged using alternating vacuum and oxygen cycles (3×), then charged to 2 MPa with oxygen and heated to 125 °C at a heating rate of 5 °C min−1 under stirring at 600 rpm. After the reaction, gas products were collected by a 0.5-l Teflon bag. Then, the liquid products were collected and the autoclave was washed using 5 ml of methanol. Finally, the product dissolved in liquid phase and unreacted solid residue is separated by centrifugation. Unless otherwise specified, all other reaction conditions are based on this. We noted a similar work during our revision. Although both studies share the same phenomenon of catalyst-free oxidative upcycling of PE, the reaction mechanisms and conclusions differ substantially51.
Applicability of other polymers oxidation
The post-consumer plastics were derived from PE gloves, LDPE bags, HDPE caps, LDPE packaging and tyres, which were cut into small pieces without any other operation. Then, 0.2 g of post-consumer polyolefin and 5 ml of deionized water were loaded into the autoclave. The sealed reactor was charged to 2 MPa with oxygen and heated to 125 °C at a heating rate of 5 °C min−1 under stirring at 600 rpm.
Measurements for •OH detection
4-CPB generates 4-hydroxybenzoic acid (4-HB) under the action of •OH/H2O2. 0.60 g of 4-CPB and 5 ml of H2O were added in the reactor. The sealed reactor was charged to 2 MPa with oxygen and heated to 125 °C at a heating rate of 5 °C min−1 under stirring at 600 rpm. The cooled solution was detected by liquid chromatography–mass spectrometry (LC–MS).
Confocal fluorescence on microdroplets
An oil-in-water emulsion was prepared by ultrasonically emulsifying 0.2 g of heptadecane in 5 ml of water to form oil microdroplets. Subsequently, Rhodamine 800 was added to the aqueous phase to a final concentration of 10 μM. The distribution of the fluorescent probe was then observed using confocal fluorescence microscopy with a wavelength of 682 nm.
Products analysis
The products analysis can be divided into three parts according to the phase state, namely, gas, liquid and solid products.
Gas products
The gas products from the Parr autoclave headspace could be quantified by the state equation for ideal gas. The temperature and pressure of the system after reaction could be directly read out by the temperature indicator and electronic pressure gauge. The internal volume of the Parr autoclave was measured by filling it with water. Then gas products were collected by a 0.5-l Teflon bag. The concentrations of CO and CO2 were determined using a gas chromatography–flame ionization detector (GC-FID) equipped with a methanization converter, which reduces CO and CO2 to CH4 over a Ni catalyst for subsequent FID detection, and a packed column (TDX-01, 2 m × 3 mm × 2 mm) with N2 as the carrier gas at a column temperature of 50 °C. The standard curves of the concentrations and their peak areas were obtained by an external standard method.
Liquid products
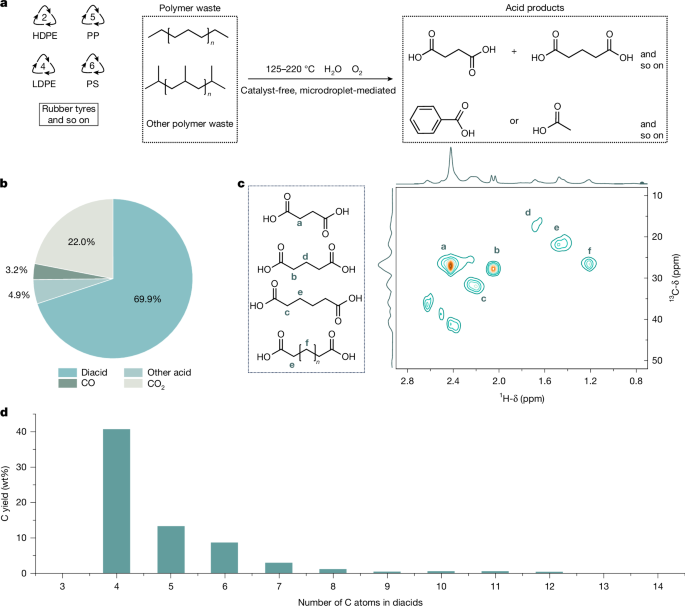
The liquid products are dominated by strongly polar, saturated dicarboxylic acids (predominantly C4–C8 diacids). To enable more accurate quantification of the individual products, the carboxylic acids were derivatized into their corresponding methyl esters using TMS-CHN2 under mild conditions before GC analysis. First, the solvents (water and methanol) were evaporated at 80 °C. Then, 14 ml of ether and 4 ml of methanol were added. While stirring in an ice-water bath, 1.6 ml of 1.5 mol l−1 TMS-CHN2 (in n-hexane) was added dropwise, followed by stirring for 2 h. Subsequently, an extra 0.16 ml of 1.5 mol l−1 TMS-CHN2 (in n-hexane) was added and the reaction was stirred for another 3 h. Finally, the reaction was quenched with 0.14 ml of acetic acid. After centrifugation, the liquid products were analysed on a GC-FID equipped with a capillary column (SH-Stabilwax, 30 m × 0.25 mm × 0.25 μm). The temperature ramp programme was: 40 °C (hold 6 min) and ramp 10 °C min−1 to 260 °C (hold 20 min) to ensure that all of the liquid products could be measured. The liquid products were also identified by a gas chromatography–mass spectrometer equipped with a capillary column (SH-Rtx-1, 30 m × 0.25 mm × 0.25 μm). The temperature ramp programme was: 40 °C (hold 10 min) and ramp 10 °C min−1 to 270 °C (hold 10 min). The standard samples were esterified for the standard curve using the same procedure. Before esterification, a certain amount of diacid standard (dibasic acid standard for C3–C16) was dissolved in methanol to obtain 5.00 mg ml−1, 2.50 mg ml−1, 1.00 mg ml−1, 0.50 mg ml−1 and 0.10 mg ml−1 solution, respectively. The concentration of the product is calculated using the standard curve.
Solid products
After centrifugation, the insoluble solid was dried at 80 °C overnight and then weighed to determine the mass of the solid residue. The conversion was calculated by comparing the mass of the residue with the initial mass of the polymer. The molecular weight of the residual hydrocarbons was measured by HT-GPC (dissolved in trichlorobenzene, 150 °C).
The yield of the different products was calculated as
$$Y_\rmcarbon=\frac\fracc\times VM_\rmDC\times n\times M_\rmCm_\textC-PE$$
in which c is the concentration of diacid quantified by standard curve, V is the volume of solution, n is the number of carbons in a dibasic acid, MC is the atomic mass of C element, MDC is molar mass of dibasic acid and mC-PE is the carbon mass of PE.
The carbon balance (C.B.) was calculated as
$$\rmC.B.=\frac\sum \fracc\times VM_\rmDC\times n\times M_\rmC+m_\rmCO+m_\rmCO_2m_\textc-PE$$
in which mCO and \(m_\rmCO_2\) are the masses of CO and CO2, respectively.
Scale-up experiments
The plastic substrates used for scale-up experiments were derived from commercially available PE plastic bags. A total of 300 g of shredded PE plastic was loaded into a 5-l semi-batch reactor together with 3 l of deionized water. The reactor was then pressurized with 2 MPa of O2 and heated to 125 °C under stirring at 600 rpm for 48 h. After the reaction, the system was cooled to room temperature and depressurized and the resulting liquid product was collected (Supplementary Video 4). The reaction solution was concentrated to 800 ml by heating at 80 °C, cooled to 40 °C and acidified to pH 2.5–3.0 using HCl. The solution was then extracted with ethyl acetate (EtOAc) in three steps (300 ml ×1, 200 ml ×2). The combined organic phases were concentrated by slow evaporation of the oil bath at 60 °C for further processing. The aqueous phase was reheated to 80 °C, treated with 5 g of activated carbon (Brunauer–Emmett–Teller (BET) surface area about 900 m2 g−1, purchased from Jiangsu Zhuxi Activated Carbon) under vigorous stirring for 20 min and hot-filtered. The filtrate was then concentrated by slow evaporation of the oil bath to 400 ml at 60 °C and slowly cooled at a rate of 0.5 °C min−1 to 0–5 °C in ice water. The resulting precipitate was collected by filtration, washed with 2 × 50 ml ice-cold water and identified as crude adipic acid. The mother liquor was further concentrated to 150 ml, held at 40 °C for 30 min and then cooled to 0–5 °C to yield crude glutaric acid on filtration and 2 × 30 ml cold ethanol (as received) washing. The remaining mother liquor was concentrated to 50 ml, mixed with 100 ml of ethanol, dissolved at 60 °C and subsequently cooled to 0–5 °C to obtain crude succinic acid by filtration. Each crude product was then subjected to recrystallization by heating to dissolve and cooling in an ice bath to obtain purified products.
In situ Raman analysis
We conducted confocal Raman microscopy using a LabRAM HR800 system (Horiba Jobin Yvon) equipped with a 531.95-nm laser light source (frequency-doubled Nd:YAG laser 20 mW) and a charge-coupled device (CCD) detector. The system used an Ar+ 532-nm laser excitation source, a 400-μm pinhole and a 100-μm entrance slit, along with a 50× long-working-distance objective lens. Two types of diffraction grating (1,800 grooves mm−1 and 600 grooves mm−1) were used to obtain spectra at different resolutions. Before each set of measurements, the system was calibrated using a silicon wafer, with the silicon peak set to 520.7 cm−1.
A fused silica capillary reactor containing deionized water was mounted on the microscope stage and the stage height and orientation were adjusted to clearly visualize the capillary. The optical path was then switched for Raman spectral acquisition. Spectra were recorded over the 400–4,000-cm−1 range with an exposure time of 30 s and two accumulations per measurement, enabling analysis of the chemical bonding features.
Industry upscaling framework
The upcycling process operates under mild aqueous conditions without the use of precious metal catalysts or complex solvents, indicating strong potential for industrial scale-up and subsequent techno-economic analysis (TEA). The key financial metrics are reported using a 15-year project horizon. It should be noted that this TEA represents a conceptual-level analysis based on laboratory-scale experimental data and standard engineering correlations. Key assumptions, including the 12 h residence time, product price and capital cost estimates, carry inherent uncertainties that are typical of early-stage process evaluations. The sensitivity analysis provided in Extended Data Fig. 9d addresses these critical uncertainties.
Reactor design and throughput optimization
The TEA uses a 12 h residence time assumption based on a continuous plug-flow reactor (PFR) configuration. This design addresses the limitations of batch reactors by enabling: (1) continuous microdroplet generation; (2) segmented thermal management; and (3) distributed oxygen supply. These features are engineered to substantially improve kinetic performance relative to non-optimized batch systems. The economic effect of varying residence times from 3 h to 48 h is detailed in the sensitivity analysis in Extended Data Fig. 9e. At larger scales, established industrial mixing and contacting strategies can be used.
Continuous plug-flow feeding. A plug-flow configuration with a melt/feeding module and inline emulsification stabilizes droplet formation, limits solids inventory and allows precise residence-time control, facilitating scale-up.
High-shear and turbulent agitation. A combined impeller strategy can be used: (1) a high-shear impeller (for example, serrated turbine) in the lower reactor zone fragments molten polymer into fine droplets; (2) an upper axial-flow impeller circulates material to the shear zone, minimizing dead zones; (3) gas entrainment along the shaft enhances O2 or air distribution, improves gas–liquid mixing, reduces slurry density and promotes sustained oil–water contact.
Further interfacial intensification. If required, Venturi or other hydrodynamic mixers can generate intense shear and turbulence to produce fine droplets and renew interfacial area. Small amounts of emulsifiers can further stabilize dispersed droplets. Such approaches are widely applied in industrial gas–liquid and solid–liquid–gas processes and are directly compatible with molten-polymer-in-water systems.
Operationally, the key controllable parameters are polymer melting/softening temperature, shear intensity, stirring rate and oxygen (or gas) management. Collectively, these measures allow replication and intensification of the microdroplet interfacial environment observed in the laboratory at larger throughput, while maintaining energy efficiency and operational safety using established engineering practices.
Feedstock logistics
Establishing robust preprocessing systems compatible with heterogeneous commercial plastic waste streams, including advanced spectroscopic sorting (for example, AUTOSORT FLAKE integrates near-infrared spectroscopy, high-resolution imaging, metal detection and AI-assisted classification) for polymer identification and separation, followed by cleaning. Molten or softened polymers can then be continuously delivered using heated screw feeders or extruders, enabling stable feeding, composition control and seamless integration with downstream oxidative upcycling units. The framework applies a 20% relative solvent reduction on scale-up, with reactant and auxiliary stream flow rates scaled linearly52.
Material recycling and energy recovery
Heat integration strategies were applied to reduce steam and cooling water requirements. Oxygen and water were internally recycled to minimize fresh feedstock inputs. The Calculator module in Aspen was used to ensure constant feed ratios under steady-state conditions, with water-to-PE and oxygen-to-PE mass ratios fixed at 8:1 and 3.15:1, respectively.
Product separation
After the reaction, the cooled gas–liquid effluent was subjected to a flash tank for separation. The gaseous fraction (containing CO) was combusted for safety; the resulting flue stream was then processed using a MEA-based CO2 capture unit (assumed CO2 capture efficiency = 50% (ref. 53)). This separation step was not explicitly modelled in Aspen but was treated using representative industrial data. The liquid fraction was flashed to separate water from higher-boiling products. The recovered water was recycled to the process, with a 1% purge stream to prevent impurity accumulation. The product stream was routed to a reactive distillation to convert succinic and glutaric acids to their corresponding anhydrides54. The anhydrides were separated from residual mixed diacids and the two anhydride products were further purified by two fractional distillations.
A full list of TEA assumptions (product yield composition, utility consumption rates, capital expenditure breakdown, operating expenditure items and key financial parameters) is provided in Supplementary Tables 6–10.
Life-cycle assessment methods
To demonstrate our upcycling environmental benefit, a comprehensive and systematic life-cycle assessment (LCA) is used, followed four phases defined in the ISO 14040 standards55: (1) goal and scope definition; (2) inventory analysis; (3) impact assessment; and (4) interpretation. Choices about the study, including the intended application, the methodological framework, the system boundary, the functional unit and the approach to multifunctionality, are made in the goal and scope phase. Environmental flow for all inputs and outputs of each process are collected during the life-cycle inventory (LCI) phase, encompassing raw materials, energy streams, emissions and wastes. Both the foreground and background inventories are subsequently translated into quantified environmental impacts during the life-cycle impact assessment phase. This translation uses characterization methods grounded in scientifically established environmental mechanisms that trace cause–effect pathways through which elementary flows—emitted substances or consumed resources—contribute to specific environmental damage categories. Finally, the interpretation phase critically evaluates whether conclusions derived from the impact assessment are sufficiently substantiated and robust, examining key assumptions, performing sensitivity analyses across various scenarios and identifying limitations before formulating recommendations for decision-making.
The LCA follows the guidance of ISO 14040 standards and the International Reference Life Cycle Data System (ILCD) Handbook56, as detailed below. The nominal LCA (phases 2 and 3) is calculated using the Brightway 2.5 package57 with the ecoinvent 3.11 (ref. 58) database.
Goal and scope definition
The goal of this study is to compare the environmental impacts of a new chemical upcycling technology against established end-of-life management options for waste PE in Europe, namely, mechanical recycling (MR), incineration and landfilling, aiming to evaluate the potential sustainability benefit of chemical upcycling as an alternative pathway. This study follows an attributional LCA framework.
The system boundary is defined as a gate-to-gate waste treatment system, starting from the entry of waste PE into the treatment facility and ending at the completion of waste PE treatment and the production of valuable chemicals. Pretreatment requirements differ substantially across the three scenarios. For landfilling and incineration, only waste transport is included, as these processes accept mixed plastic waste with minimal preprocessing—a conservative assumption that does not disadvantage the baseline scenarios. For the chemical recycling process and the MR process, a full pretreatment chain comprising transport, sorting, washing, drying, shredding, grinding and pelletization is included, consistent with its feedstock purity requirements. System boundary diagrams for all scenarios are provided in Extended Data Fig. 10a.
The functional unit is defined as the treatment of 1 kg of waste PE and the corresponding reference flow is 1 kg of waste PE. As the upcycling process results in the joint production of several valuable chemical products, as well as the liquid CO2, the system exhibits multifunctionality. Subdivision of the process is not applicable owing to the integrated nature of the joint production system.
Therefore, multifunctionality was addressed through system expansion. For the upcycling scenario, avoided burdens were assigned for the virgin chemical products and liquid CO2 displaced by the upcycling system. As the recovered chemical products exhibited purities of more than 99%, a substitution factor of 1 was assumed. For the incineration and landfill scenarios, credits were assigned for recovered electricity and heat, assumed to displace grid electricity and industrial heat production, respectively. Landfill gas capture and use generate 0.006389 kWh of electricity and 0.01152 MJ of useful heat per functional unit, whereas incineration generates 1.38 kWh of electricity and 9.62 MJ of thermal energy per functional unit. A substitution factor of 1 was applied to both energy products. For the MR scenario, recycled PE was assumed to substitute virgin LDPE and HDPE according to their respective shares in the European plastics market, with LDPE and HDPE accounting for 58% and 42%, respectively59, which were used as proxies for the composition of the waste PE stream. To account for quality degradation and regulatory or market constraints limiting the use of mechanically recycled plastics in certain applications, substitution factors of 0.5 for LDPE and 0.65 for HDPE were applied on the environmental assessment of plastic waste recycling60.
Life-cycle inventory
Mass and energy flows for the waste PE treatment were modelled using Aspen Plus based on an optimized process flow diagram. These foreground inventories were subsequently integrated with background datasets from the ecoinvent database to quantify the LCIs for all scenarios. A detailed list of foreground flows for the upcycling technology, normalized to the functional unit, is provided in Supplementary Table 11. A conservative estimation approach was used during LCI construction to prevent favourable bias towards the upcycling scenario.
Owing to the lack of a directly applicable background dataset and the high process cooling demand, the cooling utility was modelled using two scenarios: a worst-case scenario using ecoinvent data and a standard scenario in which a wet cooling tower was sized on the basis of the estimated cooling heat duty. Inventory data for the cooling tower were adopted from the disaggregated LCA developed in ref. 61, in which fan and pump electricity consumption, decarbonized make-up water, blowdown wastewater and evaporative water losses were shown to account for more than 97% of total life-cycle impacts. Accordingly, only these flows were included in the present study.
The LCIs for conventional treatment options were proxied using the following ecoinvent datasets: ‘treatment of waste polyethylene, sanitary landfill CH | Cut-off’ and ‘treatment of waste polyethylene, municipal incineration FAE CH | Cut-off’, combined with ‘market for transport, freight, lorry, unspecified RER | Cut-off’ for logistics. The avoided products of electricity and heat recovered from incineration and landfill were modelled using ‘market group for electricity, medium voltage RER | Cut-off’ and ‘market group for heat, district or industrial, natural gas RER | Cut-off’, respectively. MR scenarios were modelled using the ecoinvent datasets ‘polyethylene production, low density, granulate RER | Cut-off’ and ‘polyethylene production, high density, granulate RER | Cut-off’ as proxies for recycled LDPE and HDPE production, respectively.
Life-cycle impact assessment
The LCI results were characterized into environmental impacts using the cumulative energy demand (CED)62 and ReCiPe 2016 methodology63. These impacts were first categorized into 18 midpoint indicators, including global warming, toxicity, ozone depletion and land use, and then further aggregated into three end-point categories: the damage areas of resources, human health and ecosystems quality. This multi-indicator approach ensured a holistic evaluation of the environmental trade-offs between the new upcycling process and conventional waste management options. The results, normalized to the functional unit, are presented in Supplementary Tables 12 and 13.
Interpretation
Contribution analyses were initially performed to identify the key parameters influencing the environmental impacts. We then conducted a scenario analysis to evaluate the effects of parameter variations on the overall environmental burdens. On the basis of these results, recommendations were formulated to inform future process optimization and industrialization pathways.
LCA results
Extended Data Figure 10b presents the nominal LCA results for greenhouse gas (GHG) emissions and CED per kg of waste PE treated. The complete set of midpoint and end-point impact indicators is reported in Supplementary Tables 12 and 13. The comparison shows that, in the standard scenario, the proposed upcycling technology has lower GHG emissions than both pure incineration (−0.30 versus 2.11 kg CO2-eq) and pure landfilling (−0.30 versus 0.15 kg CO2-eq), turning the process from a source of emissions into a net carbon sink. Its GHG emissions are only slightly higher than those of MR (−0.30 versus −0.35 kg CO2-eq), showing that the proposed upcycling technology can achieve GHG emission performance comparable with MR. For CED, the upcycling technology provides clear energy savings (−17.00 MJ) compared with landfilling (0.36 MJ), although incineration (−22.54 MJ) and MR (−28.16 MJ) save more energy as a result of direct energy recovery and avoided production of new materials, respectively. In the worst-case scenario, these benefits become smaller—GHG emissions increase to 0.71 kg CO2-eq and the CED benefit reduces to −1.54 MJ—but the technology still outperforms incineration on GHG emissions and still saves energy overall. Landfilling has low GHG emissions but is limited by land availability and long-term environmental risks, whereas MR is limited by strict requirements on input quality and the degradation of material properties after repeated recycling.
At the end-point level under the standard scenario, the upcycling technology performs better than incineration and landfilling across the three damage categories—human health, ecosystem quality and resource scarcity—and only slightly worse than MR. At the midpoint level, the upcycling technology outperforms incineration in 8 out of 18 indicators and landfilling in 10 out of 18 indicators, whereas it falls slightly short of MR across all indicators. Although the upcycling technology does not outperform MR on any individual midpoint indicator and shows mixed results against incineration and landfilling at the midpoint level, it delivers a more favourable overall profile at the end-point level, ranking close to MR and clearly above incineration and landfilling across the three damage categories. Given the conservative credit assignment used here—and the omission of substitution effects for high-carbon diacids mixture—the actual environmental performance of the proposed technology is probably better than reported, which supports its potential as a complementary route for PE waste management.
To better understand the structure of impacts and identify opportunities for further improvement of the upcycling technology, contribution analyses were conducted under the worst-case scenario for GHG emissions and terrestrial acidification potential (TAP) (Extended Data Fig. 10c,d). The worst-case scenario was selected as the basis for this analysis because it represents the most burdensome configuration of the system, in which the underlying impact structure most clearly reveals where the largest improvement opportunities lie. GHG emissions and TAP were chosen as the representative impact categories because they reflect the two contrasting outcomes of the comparison with conventional waste treatment: the upcycling technology shows lower GHG emissions but higher TAP than incineration and landfilling. Analysing both therefore reveals the drivers behind its environmental advantages as well as its remaining limitations. The results indicate that cooling energy is the dominant contributor, accounting for approximately 34% of the total GHG emissions score and 28% of the total TAP score. The feedstock PE pellets are the second-largest contributor, accounting for approximately 25% of the total GHG emissions score and 22% of the total TAP score. Notably, oxygen feedstock contributes only about 13% to the GHG emissions score, while accounting for 21% of the TAP score, reflecting differences in characterization factors and substance-specific impact pathways across the two impact categories.
Taken together, these findings identify cooling energy as the most influential point of the system, which is also consistent with the substantial performance gap between the worst-case and standard scenarios—a gap driven mostly by differences in how the cooling utility is modelled. The favourable performance observed under the standard scenario is technically achievable at industrial scale through the use of properly sized cooling infrastructure. Apart from cooling energy, oxygen supply represents the next main opportunity for further reducing the environmental impact. Future developments in water-electrolysis-based green hydrogen technologies, in which oxygen is generated as a co-product, may substantially lower the environmental burden from oxygen supply64. Such technological advances could enhance the overall environmental performance of the upcycling process and highlight the importance of considering dynamic background system changes in prospective LCAs.
Ethics statement
This study did not involve human participants or animal experiments.

