


Cells and culture conditions
Ovcar8, JHOS4, Uwb1.289 and PEO1 cells were a gift from Benjamin Bitler (University of Colorado). Ovcar8 cells were cultured in RPMI 1640 medium (Gibco, 11875119) supplemented with 5% fetal bovine serum (FBS; BioWest, S1620) and 1% penicillin–streptomycin (Fischer Scientific, 15-140-122). JHOS4 cells were cultured in a 1:1 mixture of Dulbecco’s Modified Eagle Medium (DMEM) (Gibco, 11965092) and Ham’s F-12 (DMEM/HamF12) supplemented with 10% FBS (BioWest, S1620), 0.1 mM non-essential amino acids (Gibco, 11140050) and 1% penicillin–streptomycin (Fischer Scientific, 15-140-122). Uwb1.289 cells were cultured in a 1:1 ratio of RPMI 1640 (Gibco, 11875119) and MEGM (Sigma-Aldrich, C39110) supplemented with 3% FBS (BioWest, S1620) and 1% penicillin–streptomycin (Fischer Scientific, 15-140-122). PEO1 cells were cultured in RPM1-1640 medium (Gibco, 11875119) supplemented with 10% FBS (BioWest, S1620), 2 mM glutamine (Gibco, 25030081), 2 mM pyruvate (Gibco, 11360070) and 1% penicillin–streptomycin (Fischer Scientific, 15-140-122). Ovcar8-empty vector (EV) and Ovcar8-CCNE1 cell lines were created by transduction of a cyclin E1-overexpression plasmid generated by Twist Bioscience (pTwist Lenti SFFV Puro). These cell lines were cultured in RPMI 1640 medium (Gibco, 11875119) supplemented with 5% FBS (BioWest, S1620), 1% penicillin–streptomycin (Fischer Scientific, 15-140-122) and 1 µg ml−1 puromycin (Gibco, A1113802). FT282-EV and FT282-CCNE1 cells were a gift from Ronny Drapkin (University of Pennsylvania). FT282-EV and FT282-MYC cell lines were created by transduction with pCDH-EF1-FHC (Addgene, 64874) or pCDH-Flag-c-Myc (Addgene, 102626), respectively. FT282 cells were cultured in DMEM:F12 supplemented with 2% FBS and 1% penicillin–streptomycin under 2% oxygen conditions (with 1 µg ml−1 puromycin when transduced with Twist plasmids). HepG2 cells were purchased from ATCC and cultured in DMEM (Fischer Scientific, 12-430-054) supplemented with 10% FBS (BioWest, S1620) and 1% penicillin–streptomycin (Fischer Scientific, 15-140-122). The U2OS-mCherry-LacI-Fok1 cell line was a gift from Roger Greenburg (University of Pennsylvania) and was maintained in DMEM (Invitrogen, 11885084) with 10% FBS and 1% penicillin–streptomycin. To induce DSBs, cells were treated with Z-(4)-Hydroxytamoxifen (Millipore Sigma, H7904; 1 μM) and Shield-1 (TaKaRa, 632189; 1 μM) for 4 h in charcoal-stripped FBS containing medium. HEK293FT cells were used for lentiviral packaging and were cultured in DMEM (Corning, 10-013-CV) supplemented with 10% FBS, according to ATCC’s instructions. Kuramochi cells were a gift from Ronald Buckanovich (University of Pittsburgh) and cultured in RPMI 1640 medium (Gibco, 11875119) supplemented with 5% FBS (BioWest, S1620) and 1% penicillin–streptomycin (Fischer Scientific, 15-140-122). KPCA.B cells were a gift from Robert Weinberg (Whitehead Institute of Biomedical Research) and cultured in DMEM media (Fischer Scientific, 12-430-054) supplemented with 1% insulin-transferrin-selenium (Thermo Fisher Scientific; ITS-G, 41400045), 100 μl EGF (10 µg ml−1), 4% heat-inactivated FBS (Thermo Fisher Scientific; IFS, F4135) and 1% penicillin–streptomycin (Fischer Scientific, 15-140-122). Cells were cultured in humidified incubators at 37 °C, 5% CO2 and atmospheric oxygen, except FT282 cells, which were cultured at 2% oxygen. The authenticity of the cell lines was not tested. All cell lines were tested monthly for my coplasma as described42.
Plasmids, antibodies, inhibitors, treatments and metabolites
All shRNAs were obtained from Sigma-Aldrich. The RNAi consortium numbers (TCRN) are as follows: shIDH1 1, TRCN0000027253 (target sequence: GCTTTGGAAGAAGTCTCTATT); shIDH1 2, TRCN0000027249 (target sequence: CCTTTGTATCTGAGCACCAAA); shTMLHE 1, TRCN0000064804 (target sequence: GCACACTGACACTACCTATTT); shTMLHE 2, TRCN0000064807 (target sequence: CGCTTTGATTACGTCTGGCTT); shBRCA1 1, TRCN0000010305 (target sequence: AGAATCCTAGAGATACTGAA); shBRCA1 2, TRCN0000039833 (target sequence: CCCTAAGTTTACTTCTCTAAA); shCROT 1, TRCN0000036009 (target sequence: CGAGAATATCTGATTGGTCTT); shCROT 2, TRCN0000036013 (target sequence: GCCTATCTGGATGTTCGTATA); shCRAT 1, TRCN0000035495 (target sequence: GTCATCGAGTACACGAAGAAA); shCRAT 2, TRCN0000035496 (target sequence: CAAGGCATACAACACCCTCAT); shACLY, TRCN0000078286 (target sequence: GCCTAAGTACTCTTGCCAGTT). The pLKO.1 shGFP control was obtained from Addgene (30323). Wild-type IDH1 with overexpression plasmid 3× HA tag was generated by Twist Bioscience (pTwist Lenti SFFV Puro).
The following antibodies were obtained from the indicated suppliers. Primary antibodies: rabbit anti-IDH1 (8137S, RRID: AB_10950504, WB 1:1000) from Cell Signaling Technology; rabbit anti-TMLHE (16621-1-AP, RRID:AB_2205303, WB 1:1000) from Proteintech; rabbit anti-TMLHE (HPA034589, RRID:AB_10670571, IHC 1:100) from ATLAS; mouse anti-cyclin E1 (4129S, RRID:AB_2071200, clone HE12, WB 1:1000) from Cell Signaling Technology; mouse anti-Cyclin E1 (HPA018169, RRID: AB_1847384, IHC 1:500) from Sigma Aldrich; rabbit anti-MYC (13987, RRID: AB_2631168, clone D3N8F, WB 1:1,000) from Cell Signaling Technology; mouse anti-vinculin (V9131, RRID: AB_477629, clone hVIN-1, WB 1:1,000) from Sigma Aldrich; rabbit pan-acetyl H3 (61638, RRID: AB_2793714, WB 1:1000, IHC 1:1,000) from Active Motif; rabbit Total Histone H3 (05-928, RRID: AB_492621, clone A3S, WB 1:1,000) from Millipore; rabbit pan-acetyl H4 (39925, RRID: AB_2687872, WB 1:1,000, IHC 1:1,000) from Active motif; rabbit Total Histone H4 (13919S, RRID: AB_2798345, clone D2X4V, WB 1:1,000) from Cell Signaling Technology; rabbit H4K8ac (GTX128957, RRID: AB_2885846, WB 1:1,000, IHC 1:1,000) from GeneTex; rabbit H4K12ac (13944S, RRID: AB_2798350, clone D2W60, WB 1:1,000) from Cell Signaling Technology; rabbit H4K23ac (39131, RRID: AB_2793165, WB 1:1,000) from Active Motif; rabbit H3K23ac (PA5-109818, RRID: AB_2855229, IHC 1:50) from Thermo; rabbit pan-acetyl H3 (PA5-114693, RRID: AB_2899329, IHC 1:200) from Thermo; rabbit H4K12ac (ab177793, RRID: AB_2651187, clone EPR17906, IHC 1:1,000) from Abcam; mouse anti-Beta Actin (A1978, RRID: AB_476692, clone AC-15, WB 1:1,000) from Sigma Aldrich; rat anti-BrdU (ab6326, RRID: AB_305426, clone BU1/75 (ICR1), IF 1:500) from Abcam; mouse anti-phospho-Histone H2A.X Ser139 (05-636, RRID: AB_309864, Clone JBW301, IF 1:500) from Millipore Sigma; rabbit anti-53BP1 (A300-272A, RRID: AB_185521, IF 1:500) from Bethyl; mouse BRCA1 (sc-6954, RRID:AB_626761, clone D-9, IF 1:500, WB 1:1,000) from Santa Cruz Biotechnology; rabbit anti-CrOT (13543-1-AP, RRID: AB_2085513, WB 1:1,000) from Proteintech; rabbit anti-CrAT (PAC400Mu01, WB 1:1,000) from Cloud-Clone Corp; rabbit anti-RAD51 (ab133534, RRID:AB_2722613, clone EPR4030(3), IF 1:500) from Abcam; mouse anti-PAR/pADPr (4335-MC-100, RRID:AB_2572318, clone 10HA, IF 1:500) from Biotechne; rabbit anti-ATP-citrate lyase (D1X6P) (ab13390, RRID:AB_2798203, clone D1X6P, WB 1:1,000), rabbit anti-G6PD (HPA000834, RRID: AB_1078977, WB 1:1,000) from Sigma Aldrich; mouse anti-LAMP2 (sc-18822, RRID: 626858, clone H4B4, WB 1:1,000) from Santa Cruz Biotechnology; rabbit anti- UGGT1 (14170-1-AP, RRID: 1288973, WB 1:1,000) from ThermoFisher Scientific; rabbit anti-HSP60 (D6F1) XP (ab12165, RRID:AB_2636980, clone D6F1, WB 1:1;000); normal mouse IgG (2025, RRID: AB_737182, ChIP 2 μg) from SantaCruz Biotechnology; normal rabbit IgG (2729S, RRID: AB_1031062, ChIP 2 μg) from Cell Signaling Technology; Histone H4K8ac (A7258, RRID: AB_2767802, WB 1:1,000) from ABclonal; Biotin (Bethyl, A15-109A, WB 1:1,000). Secondary antibodies: anti-mouse (7076, RRID:AB_330924, WB 1:5,000) and anti-rabbit (7074, RRID: AB_2099233, WB 1:5,000) horseradish peroxidase (HRP)-conjugated secondary antibodies from Cell Signaling Technology. For immunofluorescence, fluorescein donkey anti-rat IgG (712-095-150, RRID: AB_2340651, 1:5,000) from Jackson ImmunoResearch Laboratories; fluorescein donkey anti-mouse IgG (715-095-150, RRID: AB_2340792, 1:5,000) from Jackson ImmunoResearch Laboratories; fluorescein (FITC)-affinity pure donkey anti-rabbit (711-095-152, RRID: AB_2315776, 1:5,000) from Jackson ImmunoResearch Laboratories; Cy3Goat anti-rabbit (111-165-003, RRID: AB_2338000, 1:5,000) from Jackson ImmunoResearch Laboratories; Cy3-affinity pure donkey anti-mouse (715-165-150, RRID:AB_2340813, 1:5,000) from Jackson ImmunoResearch Laboratories.
The inhibitors used in this study are as follows: GSK864 (IDH1 inhibitor, MedChem Express, HY-19540); olaparib (PARP inhibitor, ApexBio, A4154); veliparib (PARP inhibitor, Selleck Chemicals, S1004); niraparib (PARP inhibitor, ChemScene, CS-0780); cisplatin (Selleck Chemicals, S1166); mildronate (carnitine synthesis inhibitor, Selleck Chemicals, S4130); (Z)−4-hydroxytamoxifen (Millipore Sigma, H7904); Shield-1 (TaKaRa, 632189); WM-3835 (HAT inhibitor, Selleck Chemicals, S9805); PARG inhibitor (Tocris, PDD00017273, 5952). The metabolites used in this study are as follows: αKG (dimethyl-2-oxoglutarate, Sigma Aldrich, 340631); triethyl citrate (Sigma Aldrich, 14849); diethyl succinate (Sigma Aldrich, 112402); l-carnitine hydrochloride (Millipore Sigma, C0283); O-acetyl-l-carnitine hydrochloride (Sigma Aldrich, A6706); propionyl-l-carnitine (Cayman Chemical Company, 9001873); butyryl-l-carnitine (Cayman Chemical Company, 26542); N-acetyl-l-cysteine (Sigma Aldrich, A7250); and sodium acetate (Millipore Sigma, 127-09-3).
Metabolite measurement
Metabolites were measured by liquid chromatography–high-resolution mass spectrometry adapted from two previously published approaches for polar metabolites43 and acyl-CoAs44. For polar metabolomics of carnitines and tricarboxylic acid (TCA) cycle metabolites, samples were quenched in 1 ml pre-chilled at −80 °C 80:20 methanol:water (vol/vol) and spiked with 50 µl 1 µM isotope-labelled TCA cycle mix (Cambridge Isotope Laboratories, MSK-TCA-A) prediluted in 80:20 methanol:water and 50 µl 0.02 ng µl−1 propionyl-l-carnitine-(N-methyl-d3) (Sigma Aldrich, 52941). After vortexing for 1 min, samples were returned to −80 °C for 30 min, centrifuged at 18,000g for 10 min at 4 °C, and the supernatant was transferred to a deep-well 96-well plate and evaporated to dryness under nitrogen gas. Samples were reconstituted in 100 µl, and 2 µl of the sample was injected from a 4 °C autosampler into a ZIC-pHILIC 150 × 2.1 mm 5 µm particle size column (EMD Millipore) with a ZIC-pHILIC 20 × 2.1 guard column in a Vanquish Duo UHPLC system (Thermo Fisher Scientific) at 25 °C. Chromatography conditions were as follows: buffer A was acetonitrile; buffer B was 20 mM ammonium carbonate, 0.1% (vol/vol) ammonium hydroxide in water without pH adjustment, with a gradient of 0.5 min at 20% A, then a linear gradient from 20% to 80% B; 20–20.5 min: from 80% to 20% B; 20.5–28 min: hold at 20% B at a 0.150 ml min−1 flow rate. Column elute was introduced to a Q Exactive Plus with a HESI II probe operating in polarity switching mode with full scans from 70 to 1,000 m/z with an insource fragmentation energy of 1. Acyl-CoA quantification and isotope tracing were measured by liquid chromatography–high-resolution mass spectrometry, as previously described in detail45 with internal standards generated as described46. In brief, samples were quenched in 1 ml 10% (wt/vol) trichloroacetic acid in water for extraction. Samples were homogenized by using a probe tip sonicator in 0.5-s pulses 30 times then centrifuged at 17,000g for 10 min at 4 °C. Supernatant was purified by solid-phase-extraction cartridges (Oasis HLB 10 mg, Waters) that were conditioned with 1 ml of methanol and 1 ml of water. Acid-extracted supernatants were loaded onto the cartridges and washed with 1 ml of water. Acyl-CoAs were eluted with 1 ml of 25 mM ammonium acetate in methanol and evaporated to dryness under nitrogen. Samples were resuspended in 50 µl of 5% (wt/vol) 5-sulfosalicyilic acid and 20-µl injections were analysed on an Ultimate 3000 UHPLC using a Waters HSS T3 2.1 × 100 mm 3.5 µm column coupled to a Q Exactive Plus with a HESI II probe operating in positive-ion mode.
The analysts were blinded to sample identity during processing and quantification. Instruments were controlled using XCalibur v.4.1 and data were analysed on Tracefinder 5.1 using a 5-p.p.m. window from the predominant ion, either positive (carnitines and acyl-CoAs) or negative (all other analytes). The area under the curve for each analyte was normalized to the matched internal standard or the nearest surrogate internal standard. For isotope tracing, isotopologue enrichment was calculated using FluxFix: Isotopologue Analysis tool (v.0.1)47.
Crystal violet assays
For all experiments, an equal number of cells was seeded in 96-well plates. For IDH1 inhibitor, carnitine synthesis inhibitor and HAT inhibitor studies: cells were treated for 5 days with IC10–20 doses of GSK864, mildronate, HAT inhibitor or metabolites (see Supplementary Table 1 for concentrations). For glutamine-starvation assays, cells were seeded in standard growth medium. The next day, the medium was changed to glutamine-free medium (Fischer Scientific, 21870076) with or without metabolite supplementation for 5 days. On the fifth day, cells were also treated with olaparib or cisplatin (see Supplementary Table 1 for concentrations) every other day for 5 more days. For gamma-radiation experiments, cells were irradiated once on the fifth day. For TMLHE-knockdown experiments, cells were transduced, selected and seeded into 96-well plates. Cells were subsequently treated with olaparib or cisplatin and metabolites (see Supplementary Table 1 for concentrations) every other day for 5 days. For all experiments, the percentage relative survival was assessed at the end point by fixing the plates in 1% paraformaldehyde for 5 min, after which they were stained with 0.05% crystal violet. Wells were de-stained using 10% acetic acid. Absorbance (at 590 nm) was measured using a spectrophotometer (BioTek Epoch Microplate reader). The percentage relative survival was calculated by normalizing to the appropriate controls indicated in the figure legends.
Western blotting
Cells lysates were collected in 1× sample buffer (2% SDS, 10% glycerol, 0.01% bromophenol blue, 62.5 mM Tris, pH 6.8, 0.1 M DTT), boiled to 95 °C for 10 min and sonicated. Protein concentration was determined using the Bradford assay (Bio-Rad, 5000006). An equal amount of total protein was resolved using SDS–PAGE gels and transferred to nitrocellulose membranes (Fisher Scientific) at 110 mA for 2 h at 4 °C. Membranes were blocked with 5% non-fat milk or 4% BSA in TBS containing 0.1% Tween-20 (TBS-T) for 1 h at room temperature. Membranes were incubated overnight at 4 °C in primary antibodies in 4% BSA/TBS + 0.025% sodium azide. Membranes were washed four times in TBS-T for 5 min at room temperature after which they were incubated with HRP-conjugated secondary antibodies in 5% milk/TBS-T for 1 h at room temperature. After washing four times in TBS-T for 5 min at room temperature, proteins were visualized on film after incubation with SuperSignal West Pico PLUS Chemiluminescent Substrate (ThermoFisher).
In vivo mouse experiments
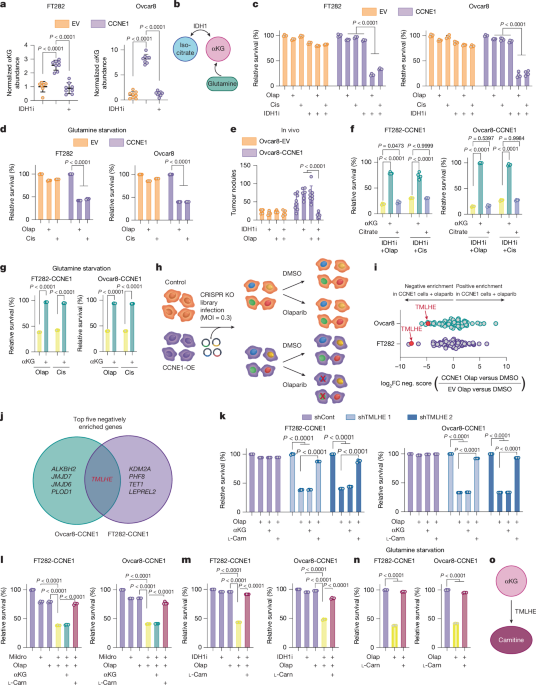
Female mice 8–12 weeks old were purchased from Jackson Laboratories (Nu/J mice, 002109; C57Bl6/J mice, 000664). All mice were maintained in a HEPA-filtered ventilated rack system at the animal facility in the Assembly Building of the Hillman Cancer Center at the University of Pittsburgh School of Medicine. Mice were housed with up to five mice per cage and in a 12 h:12 h light:dark cycle. The dark:light cycle and ambient temperature and humidity were centrally regulated and animals were closely monitored by resident veterinarians for their well-being. All experiments with animals were done in accordance with institutional guidelines approved by the Institutional Animal Care and Use Committee (IACUC) at the University of Pittsburgh School of Medicine. Humane end points were a greater than 20% change in weight and body condition score of 2 (out of 5). None of these limits were exceeded in any of the experiments. Statistical methods were not used to choose sample sizes. The number of animals assigned per condition was selected to account for the variability of the examined phenotypes, on the basis od pilot experiments and past experience with the animal models. For all studies, the animals were randomized into groups. Investigators were not blinded to group allocation during experiments owing to technical limitations. For the xenograft experiment in Fig. 1e, 5 × 10⁶ Ovcar8-empty vector or Ovcar8-CCNE1-overexpressing cells were injected intraperitoneally (IP). After allowing tumours to establish for nine days, mice were randomly assigned to vehicle, olaparib alone, GSK864 alone or olaparib + GSK864 groups. For the first week, mice were treated by daily IP injection of vehicle or 150 mg per kg body weight GSK864 (Cayman Chemical Company, 13960) diluted in 100 µl of 16.7(PG):3.3(DMSO):40(PEG400):40(H2O). After the first week, GSK864 treatment was reduced to twice a week and maintained at 30 mg per kg. Olaparib, diluted in 200 µl of 6.8(DMSO):60(PEG300):132(H2O), was administered daily by oral gavage for the following three weeks. Mice were weighed weekly. Animals were euthanized at the end of fourth week and tumour burden was assessed by counting the number of intraperitoneal nodules. Omental tumours were collected for metabolite and IHC analysis. For in vivo experiments using the carnitine synthesis inhibitor alone, 3 × 10⁶ cells (either Ovcar8-CCNE1-overexpressing cells or KPCA.B cells) were injected IP in female mice. After allowing tumours to establish for nine days, mice were randomly assigned to vehicle or mildronate-alone treatment. Mice were treated by daily IP injection of vehicle or 100 mg per kg mildronate (carnitine-synthesis inhibitor; Selleck Chemicals, S4130) diluted in saline. Mice were weighed at the beginning of treatment initiation. After one week, animals were euthanized and omental tumour samples were collected for protein isolation, metabolomics and immunohistochemistry (IHC). Tumour protein lysates were generated using a mortar and pestle over liquid nitrogen. Samples were resuspended in 1× sample buffer (see the Western blotting section for further details). For in vivo experiments with the carnitine-synthesis inhibitor in combination with cisplatin, 1 × 10⁶ KPCA.B cells were injected IP in female mice (schematic in Extended Data Fig. 12b). After allowing tumours to establish for nine days, mice were imaged using IVIS and randomly assigned to groups. For the first week, mice were treated by daily IP injection of vehicle or 100 mg per kg mildronate diluted in saline. After the first week, mildronate treatment was reduced to three times per week and maintained at 100 mg per kg. Cisplatin treatment (2 mg per kg in saline) was started after the first week of only vehicle or mildronate treatment. Mice were weighed weekly. After 1 week of cisplatin treatment, animals were euthanized, intraperitoneal tumour nodules were counted and omental tumour samples were collected. Mice were excluded from the final analysis on the basis of a lack of tumour establishment, as assessed by IVIS imaging.
αKG-dependent dioxygenases CRISPR library construction
We constructed a pooled sgRNA library containing 64 sgRNAs targeting various genes whose enzymes require αKG as a co-factor for their activity in addition to controls targeting intragenic regions, as described previously48. We used publicly available CRISPR sgRNA design tools that optimize on-target and minimize off-target genome editing (http://crispr.dfci.harvard.edu/SSC/) and pooled human metabolic library49 to identify ten sgRNAs for each gene. The pooled oligonucleotide library was synthesized by Twist Bioscience. The oligonucleotide library was cloned as previously described48 into lentiCRISPRv2, (Addgene, 52961). In brief, the pooled oligonucleotide library was amplified using NEB Next High-Fidelity PCR Master Mix (New England Biolabs, M0541S). The purified target gRNA library and digested backbone were assembled in a Gibson assembly reaction (New England Biolabs, E2611L) and isopropanol precipitated using GlycoBlue Coprecipitant (Invitrogen, AM9515) following the manufacturer’s instructions. To ensure optimal sgRNA representation, the library was sequenced, obtaining a coverage of more than 95%. The library was sequenced to ensure optimal sgRNA representation achieving 100% coverage. The sgRNA sequences can be found in Supplementary Table 2.
CRISPR drop-out screen
The human αKG dioxygenases CRISPR knockout library containing 64 genes that require αKG as a co-factor for their activity was designed as stated above. The screening was conducted on Ovcar8/Ovcar8-CCNE1 and FT282/FT282-CCNE1 isogenic cells. In brief, the appropriate number of cells were infected with pooled libraries at MOI < 0.3 to achieve more than 400-fold library coverage after selection. Selection was conducted with 500 μg of Geneticin (Thermo Fischer Scientific, 10131035) for six days. Cells were passaged every two days and the whole population was seeded to maintain the library coverage throughout. After selection, the whole amplified cell population was seeded at a ratio of 500,000 cells per 100 mm dish and treated for four days with DMSO or olaparib (4.213 μM for Ovcar8 and 4.413 μM for FT282). At the end of the experiments, cells were collected for genomic DNA extraction using the Zymo Research kit (D4069). The sgRNA inserts were PCR amplified using Ex Taq DNA polymerase (Takara, RR001A) from sufficient genome equivalents of DNA to achieve an average coverage of more than 200× of the sgRNA library (Supplementary Table 4). Pooled PCR amplicons were then sequenced using the MiSeq V2 50 cycle kit on an Illumina MiSeq sequencer. MAGeCK (0.5.9) was used as the bioinformatics pipeline to analyse negatively enriched genes. Data in Fig. 1i represent log2-fold change of negative score in (CCNE1 + olaparib versus CCNE1) versus negative score in (EV + olaparib versus EV). Processed CRISPR data and counts for each gRNA targeting TMLHE can be found in Supplementary Table 2.
IHC
IHC was done as described previously50 with slight modifications. After deparaffinization and rehydration, tissues were steamed for 40 min in 1× citrate buffer (Sigma-Aldrich, C9999), after which they were immersed in 3% MeOH for 20 min. Tissues were blocked with 1% BSA in PBS for 30 min before overnight incubation in primary antibodies. A mouse- and rabbit-specific HRP/DAB (ABC) detection IHC kit (Abcam, 4264) was used for visualization of staining. Tissues were incubated in Mayer’s haematoxylin solution (Sigma-Aldrich, MHS16) for 3 min followed by bluing in running tap water for 2 min. Tissues were dehydrated and mounted in Cytoseal (Sigma-Aldrich, C23-244257). QuPath v.0.6 was used for H-score analysis and to analyse the percentage of positive cells.
Stable isotope labelling of essential nutrients
Stable isotope labelling of essential nutrients in cell culture (SILEC) subcellular fractionation was done on HepG2 cells as previously described using SILEC media containing 15N113C3-pantothenate (vitamin B5)51. For fractionation, all steps were performed on ice. SILEC HepG2 and FT282-CCNE1 cell dishes were washed twice with ice-cold 1x PBS, and cells were scraped into ice-cold PBS. Before nuclear fractionation, 1.35 million SILEC HepG2 cells were added to around 1 million FT282-CCNE1 cells. The FT282-CCNE1/SILEC-HepG2 cell mixture was centrifuged at 400g for 5 min at 4 °C. The pellet was resuspended in 250 μl lysis buffer (10 mM HEPES, pH 7.5, 10 mM KCl, 0.1 mM EDTA, 1 mM DTT, 0.1% IGEPAL and 1× protease inhibitor cocktail) and incubated on ice for 20 min with gentle mixing every 5 min. The lysate was briefly vortexed and then centrifuged at 12,000g for 10 min at 4 °C. The nuclear pellet was washed four times by resuspending in 200 μl of lysis buffer and centrifuging at 200g for 5 min at 4 °C. Next, the nuclear pellet was resuspended in fractionation buffer (2 M sucrose, 1 mM MgCl2, 10 mM Tris-HCl, pH 7.4) and centrifuged at 16,000g for 30 min at 4 °C. The supernatant was discarded and nuclei were washed twice by resuspending in 200 μl of lysis buffer and centrifuging at 200g for 5 min at 4 °C. Then, 400 μl of 10% (wt/vol) trichloroacetic acid was added to nuclei, before storage at −80 °C. Acetyl-CoA was assessed as described in Metabolite measurement, and protein lysates were assessed for fractionation purity as described in Western blotting.
Mass spectrometry analysis of histone modifications
The cell pellet was resuspended in nuclear isolation buffer (15 mM Tris-HCl, pH 7.5, 60 mM KCl, 15 mM NaCl, 5 mM MgCl2, 1 mM CaCl2, 250 mM sucrose, 1 mM DTT, 1:100 Halt Protease Inhibitor Cocktail (Thermo Scientific, 78430) and 10 mM sodium butyrate). Nuclei were resuspended in 0.2 M H2SO4 for 1 h at room temperature and centrifuged at 4,000g for 5 min. Histones were precipitated from the supernatant by the addition of trichloroacetic acid at a final concentration of 20% (wt/vol). Precipitated histones were pelleted at 10,000g for 5 min, washed once with 0.1% HCl in acetone and twice with acetone followed by centrifugation at 14,000g for 5 min. Histones were air dried then resuspended in 10 μl of 0.1 M (NH)4HCO3 for derivatization and digestion, according to ref. 52. Peptides were resuspended in 100 μl 0.1% trifluoroacetic acid (TFA) in water for liquid chromatography–tandem mass spectrometry (LC-MS/MS) analysis.
Multiple reaction monitoring was performed on a triple quadrupole (QqQ) mass spectrometer (ThermoFisher Scientific TSQ Quantiva) coupled with an UltiMate 3000 Dionex nano-LC system. Peptides were loaded with 0.1% TFA in water at 2.5 µl min−1 for 10 min onto a trapping column (3 cm × 150 µm, Bischoff ProntoSIL C18-AQ, 3 µm, 200 Å resin) and then separated on a New Objective PicoChip analytical column (10 cm × 75 µm, ProntoSIL C18-AQ, 3 µm, 200 Å resin). Separation of peptides was achieved using solvent A (0.1% formic acid in water) and solvent B (0.1% formic acid in 95% acetonitrile) with the following gradient: 0 to 35% solvent B at a flow rate of 0.30 µl min−1 over 45 min. The following QqQ settings were used across all analyses: collision gas pressure of 1.5 mTorr; Q1 peak width of 0.7 (full width at half maximum); cycle time of 2 s; skimmer offset of 10 V; electrospray voltage of 2.5 kV. Monitored peptides were selected on the basis of previous reports53,54.
Raw MS files were imported and analysed in Skyline 23.1 software with Savitzky–Golay smoothing55. Automatic peak assignments from Skyline were manually confirmed. Peptide peak areas from Skyline were used to determine the relative abundance of each histone modification by calculating the peptide peak area for a peptide of interest and dividing by the sum of the peak areas for all peptides with that sequence. The relative abundances were determined on the basis of the mean of three technical replicates with error bars representing the standard deviation.
For analysing 13C2-acetylcarnitine-labelled histones, samples were resuspended in 10 µl of 0.1% TFA and loaded onto a Dionex RSLC Ultimate 300 (Thermo Scientific), coupled online with an Orbitrap Fusion Lumos (Thermo Scientific). Chromatographic separation was performed with a two-column system, consisting of a C-18 trap cartridge (300 µm ID, 5 mm long) and a picofrit analytical column (75 µm ID, 25 cm long) packed in-house with reversed-phase Repro-Sil Pur C18-AQ 3 µm resin. Peptides were separated using a 30 min gradient of 1–30% buffer B (buffer A, 0.1% formic acid; buffer B, 80% acetonitrile + 0.1% formic acid) at a flow rate of 300 nl min−1. The mass spectrometer was set to acquire spectra in a data-independent acquisition mode. In brief, the full MS scan was set to 300–1,100 m/z in the orbitrap with a resolution of 120,000 (at 200 m/z) and an AGC target of 5 × 10⁵. MS/MS was performed in the orbitrap with sequential isolation windows of 50 m/z with an AGC target of 2 × 10⁵ and an HCD collision energy of 30. Histone peptides raw files were imported into the EpiProfile 2.0 software56 using the 13C acetyl-labelling option. From the extracted ion chromatogram, the area under the curve was obtained and used to estimate the abundance of each peptide. Then, the relative amount of labelling was determined by comparing the unlabelled versus the labelled modified peptide. The resulting peptide lists generated by EpiProfile were exported to Microsoft Excel and further processed for a detailed analysis. The raw data have been deposited in the PRIDE (ProteomeXchange) database (project accession code: PXD060690).
Immunofluorescence and BrdU labelling
Cells were seeded at an equal density on coverslips and fixed with 4% paraformaldehyde. Cells were washed four times with PBS and permeabilized with 0.2% Triton X-100 in PBS for 5 min. Cells were blocked for 5 min with 3% BSA/PBS followed by incubation of corresponding primary antibody (see above for catalogue numbers and dilutions) in 3% BSA/PBS for 1 h at room temperature. Cells were washed three times with 1% Triton X-100 in PBS and incubated with secondary antibody in 3% BSA/PBS for 1 h at room temperature. Cells were then incubated with 0.15 µg ml−1 DAPI for 1 min, washed three times with PBS, mounted with fluorescence mounting medium (9 ml of glycerol (BP229-1, Fisher Scientific), 1 ml of 1× PBS and 10 mg of p-phenylenediamine (PX0730, EMD Chemicals); the pH was adjusted to 8.0–9.0 using carbonate-bicarbonate buffer (0.2 M anhydrous sodium carbonate, 0.2 M sodium bicarbonate)) and sealed. For DNA damage foci and RAD51 foci, at least 200 cells per coverslip were counted. Cells were considered positive when they contained more than ten γH2AX foci or more than five RAD51 foci.
For U2OS-mCherry-LacI-Fok1 cells, DSBs were induced as described above. Cells were treated with the following inhibitors and metabolites: GSK864 (10 μM), αKG (1 mM), l-carnitine (1 mM) and O-acetyl-l-carnitine (1 mM) for a period of five days, followed by inducing the DSBs with Tamoxifen (1 μM) and Shield-1 (1 μM) for a period of 4 h. After 4 h, the cells were fixed and immunofluorescence was carried out by staining only for DAPI and mCherry and DSB foci were counted. For RAD51-DSB and BRCA1-DSB co-localization, immunofluorescence was done in the manner described above using RAD51 or BRCA1 primary antibody and fluorescein donkey anti-mouse IgG secondary antibody (1:5,000). For quantification, RAD51-mCherry or BRCA1-mCherry co-localization was assessed by counting their overlap in more than 150 cells per coverslip.
For BrdU, cells on coverslips were incubated with 1 μmol l−1 BrdU for 30 min. Cells were fixed with 4% paraformaldehyde, permeabilized with 0.2% Triton X-100 and then post-fixed with 1% paraformaldehyde + 0.01% Tween-20. Coverslips were treated with DNaseI for 10 min, and the DNaseI reaction was stopped using 20 mmol l−1 EDTA. Coverslips were then blocked with 3% BSA/PBS and incubated in anti-BrdU primary antibody (1:500) followed by incubation in FITC anti-rat secondary antibody (1:1,000). For experiments to assess nuclear PAR levels in S phase, coverslips were incubated simultaneously with BrdU and PAR primary antibodies and then with corresponding secondary antibodies. Finally, coverslips were incubated with 0.15 μg ml−1 DAPI, mounted and sealed. Images were obtained at room temperature using a Nikon ECLIPSE Ti2 microscope equipped with a 20×/0.17 objective lens (Nikon DIC N2 Plan Apo). Images were acquired using NIS-Elements AR software and processed using ImageJ. To assess nuclear PAR in S phase, only BrdU-positive cells were analysed. Images were thresholded and nuclear PAR intensity was quantified using DAPI as a region of interest mask in ImageJ.
DSB assay in Xenopus egg extracts
DSB reactions were performed in Xenopus egg extracts using a combination of high-speed supernatant (HSS) and nucleoplasmic extract (NPE), as described previously26. In brief, 5 ng μl−1 of plasmid DNA was first incubated in HSS supplemented with ATP regeneration mix (ARM; 6.5 mM phosphocreatine, 0.65 mM ATP and 1.6 μg ml−1 creatine phosphokinase) and 10 μM nocodazole at 21 °C for 20 min. Next, NPE supplemented with ARM and 3.5 mM DTT was added at a 2:1 ratio. To radiolabel plasmid DNA, reactions were supplemented with [α−32P] dATP. Reactions were then incubated at 21 °C for 45 min and AgeI (0.25 U μl−1; Thermo Fisher) was added to generate a single DSB in a plasmid containing an AgeI site. Where indicated, reactions were also supplemented with IDH1i (500 μM) or αKG (500 μM). At the indicated time points, 1 μl of reaction liquid was withdrawn, diluted sixfold in replication stop dye (3.6% SDS, 18 mM EDTA, 90 mM Tris-HCl, pH 8, 90 mg ml−1 Ficoll and 3.6 mg ml−1 bromophenol blue), incubated with 20 mg proteinase K at 21 °C for 16 h and then resolved by 0.8% agarose gel electrophoresis. Agarose gels were dried and visualized by autoradiography.
Plasmid pull-down from Xenopus egg extracts
DNA-bound proteins were isolated from Xenopus egg extracts as previously described57. In brief, reaction samples were withdrawn at the indicated times and incubated with LacI-coupled magnetic beads (Dynabeads M-280; Invitrogen) suspended in pull-down buffer (10 mM Hepes, pH 7.7, 50 mM KCl, 2.5 mM MgCl2, 250 mM sucrose, 0.25 mg ml−1 BSA and 0.02% Tween 20). Beads were rotated at 4 °C for 20 min and then washed with LacI wash buffer (10 mM Hepes, pH 7.7, 50 mM KCl, 2.5 mM MgCl2, 0.25 mg ml−1 BSA and 0.03% Tween 20), dried and then suspended with 5× sample buffer (250 mM Tris–HCl, pH 6.8, 10% SDS, 0.2% bromophenol blue, 30% glycerol and 500 mM β-mercaptoethanol). DNA-bound proteins were then resolved by SDS–PAGE and visualized by western blotting.
Metabolite analysis of Xenopus egg extracts
Samples were withdrawn from Xenopus egg extract reactions 30 min after IDH1 inhibition, quenched in cold methanol and then extracted and analysed by mass spectrometry as described above.
Oxygen consumption analysis of Xenopus egg extracts
The Agilent Seahorse XFp Metabolic Analyzer (Agilent, model S7802A) was used to assess respiration in Xenopus egg extracts as recommended by the manufacturer for mitochondrial extracts. An XFp sensor cartridge was hydrated in Agilent Seahorse XF Calibrant (Agilent,103022-100) at 37 °C in a humidified incubator (non-CO2) incubator overnight. On the day of the experiment, extract was diluted 1:10 into mitochondrial assay solution (MAS; 70 mM sucrose, 220 mM mannitol, 10 mM KH2PO4, 5 mM MgCl2, 2 mM HEPES, 1 mM EGTA and 0.2 % (wt/vol) fatty acid-free BSA, pH 7.2). Then 25 µl of diluted extract was used in a Seahorse XFp cell culture plate (Agilent, 103022-100) and centrifuged at 2,000g for 20 min at 4 °C. After centrifugation, 155 µl of pre-warmed MAS with or without 10 mM succinate and 1 mM sodium pyruvate was added to the pelleted extract. Three basal-rate measurements (3 min each) were taken and the data analysed using Agilent Wave Desktop 2.6 software.
MitoTracker analysis of Xenopus egg extracts
In brief, 2 μl of 1 μM MitoTracker Red (9082, Cell Signaling; diluted in 1× PBS) was added to 10 μl Xenopus egg extract (diluted 1:10 in 1× PBS). This was mixed gently and 2 μl was mounted on a slide for immediate imaging. Mitochondria were imaged at 40× magnification on a Nikon Eclipse Ti2 microscope with an ORCA-Fusion C14440 digital camera.
RNA isolation, quantitative PCR, sequencing and analysis
Total RNA was extracted from cells with Trizol (Ambion, 15596018) and DNase treated, cleaned and concentrated using Zymo columns (Zymo Research, R1013) following the manufacturer’s instructions. RNA was then retrotranscribed with a high-capacity cDNA reverse transcription kit (Applied Biosystems, 4368814) and 20 ng of cDNA amplified using the CFX Connect Real-time PCR system (Bio-Rad) and the PowerUp SYBR Green Master Mix (Applied Biosystems, A25742) following the manufacturer’s instructions. Primers for BRCA1: forwards, AGGAACCAGGGATGAAATCAG; reverse, TTTTCTGGATGCCTCTCAGC. Conditions for amplification were: 5 min at 95 °C, 40 cycles of 10 s at 95 °C, and 7 s at 62 °C. The assay ended with a melting curve program: 15 s at 95 °C, 1 min at 70 °C, then ramping to 95 °C while continuously monitoring fluorescence. Each sample was assessed in triplicate. Relative quantification was determined to multiple reference genes (human, PSMC4, PUM1 and B2M) to ensure reproducibility using the delta–delta CT method. For RNA-seq, RNA integrity number (RIN) was measured using a BioAnalyzer (Agilent Technologies) RNA 6000 nano kit to confirm a RIN greater than 7 for each sample. The cDNA libraries, next-generation sequencing and bioinformatics analysis was performed by Novogene. Raw and processed RNA-seq data can be found on GEO (GSE289735).
DNA fibre analysis
To assess single-stranded DNA (ssDNA) gaps, U2OS cells were pretreated with mildronate or vehicle for five days and then 10 μM olaparib for 2 h, similar to a previous report58. Cells were pulsed with 20 µM CldU in 1 ml fresh culture medium (DMEM supplemented with 10% heat-inactivated FBS and 1% penicillin–streptomycin) for 10 min at 37 °C, washed once with fresh media, pulsed with 200 µM IdU in 1 ml fresh culture media for 20 min at 37 °C and washed with 1× PBS. Cells were then permeabilized in 0.6 ml CSK100 buffer (100 mM NaCl, 10 mM HEPES, 3 mM MgCl2, 300 mM sucrose and 0.5% Triton X-100) for 10 min at room temperature, washed with 1× PBS, washed with 0.6 ml 1× S1 nuclease buffer (Invitrogen) containing 50 mM NaCl and incubated for 30 min at 37 °C in 0.6 ml 1× S1 nuclease buffer containing 50 mM NaCl, with or without 20 U ml−1 S1 nuclease (Invitrogen). The S1 nuclease buffer was removed, cells were scraped in 1 ml 0.1% BSA in 1× PBS and pelleted at 550g for 5 min and pellets were resuspended in 150 µl cold 1× PBS. DNA fibres were spread as described previously59 using 2 µl of cell sample and 7 µl of freshly made lysis buffer (200 mM Tris HCl, pH 7.4, 50 mM EDTA, 0.5% SDS). Slides were prepared in duplicate for each experimental condition. Spread fibres were dried for 10 min, fixed in freshly made 3:1 methanol:acetic acid for 5 min and dried for 7–8 min. Dried slides were stored overnight at 4 °C. The next day, slides were washed twice with 1× PBS for 5 min, incubated in 2.5 M HCl for 1 h at room temperature to denature the DNA, washed twice with 1× PBS for 5 min and blocked with 5% BSA/0.1% Triton X-100 in 1× PBS for 1 h at 37 °C in a humidified chamber. Slides were incubated with primary antibodies (rat anti-BrdU clone BU1/75 (ICR1) (Abcam, ab6326) at 1:50 to detect CldU; mouse anti-BrdU clone B44 (BD Biosciences, 347580) at 1:66.7 to detect IdU) in 2.5% BSA/0.1% Triton X-100 in 1× PBS overnight at 4 °C in a humidified chamber. The next day, slides were washed four times with 0.1% Tween-20 in 1× PBS for 5 min each and twice with 1× PBS for 5 min each. Slides were incubated with secondary antibodies (goat anti-rat Alexa Fluor 488 (Invitrogen, A11006) to label CldU; goat anti-mouse Alexa Fluor 594 (Invitrogen, A11005) to label IdU; both antibodies used at 1:150) in 2.5% BSA/0.1% Triton X-100 in 1× PBS for 1 h at 37 °C in a humidified chamber. Slides were washed four times with 0.1% Tween-20 in 1× PBS for 5 min each and twice with 1× PBS for 5 min each and were then air-dried and mounted using ProLong Diamond Antifade Mountant (Invitrogen). All the steps described above were performed with protection from light. Fibres were imaged at 60× (oil-immersion objective lens) magnification on a Nikon Eclipse Ti2 microscope with an ORCA-Fusion C14440 digital camera. The length of the IdU track in contiguous CldU and IdU tracks was measured using ImageJ.
ChIP
ChIP was performed as described previously60. Using the U20S-DSB-reporter cell line, cells were first treated with their respective inhibitors and supplementation of αKG or l-carnitine and then induced for 4 h with 4-hydroxytamoxifen and Shield-1 for the induction of DSBs28. Cells were kept in charcoal-stripped FBS containing DMEM medium for all the treatments. After induction, the medium was removed by vacuum aspiration and cells were washed twice with 20 ml of ice-cold PBS. The cells were then incubated with 20 ml of serum-free low-glucose DMEM warmed to 20–22 °C. Immediately, 556 µl of 37% formaldehyde was added to each dish to reach a final concentration of 1%. The dishes were rocked at 10–15 r.p.m. for 10 min at 20–22 °C. The crosslinking was then quenched by adding 3 ml of 1 M glycine (dissolved in PBS) to obtain a final concentration of 125 mM glycine. The dishes were rocked at 10–15 r.p.m. for another 10 min at 20–22 °C. The formaldehyde-containing DMEM was removed and cells were washed three times with 20 ml of ice-cold PBS supplemented with 1× complete protease inhibitor cocktail. The cells were then scraped and collected in 10 ml of ice-cold PBS supplemented with 1× complete protease inhibitor using a plastic cell scraper and shifted into a 50 ml conical tube on ice. Another 10 ml of ice-cold PBS with 1× complete protease inhibitor was added to the same dish to collect residual cells and these were then transferred to the same 50-ml conical tube. The cells were spun down at 250g for 5 min at 4 °C and the supernatant was removed from the cell pellet. Cells were lysed in 1 ml ChIP lysis buffer (50 mmol l−1 HEPES-KOH, pH 7.5, 140 mmol l−1 NaCl, 1 mmol l−1 EDTA, pH 8.0, 1% Triton X-100 and 0.1% deoxycholate with 0.1 mmol l−1 PMSF and the EDTA-free protease inhibitor cocktail). Samples were incubated on ice for 10 min and then centrifuged at 3,000 r.p.m. for 3 min at 4 °C. The pellet was resuspended in 500 μl lysis buffer 2 (10 mmol l−1 Tris, pH 8.0, 200 mmol l−1 NaCl, 1 mmol l−1 EDTA and 0.5 mmol l−1 EGTA with 0.1 mmol l−1 PMSF and the EDTA-free protease inhibitor cocktail) and incubated at room temperature for 10 min. Samples were centrifuged at 3,000 r.p.m. for 5 min at 4 °C. Next, the pellet was resuspended in 300 μl lysis buffer 3 (10 mmol l−1 Tris, pH 8.0, 100 mmol l−1 NaCl, 1 mmol l−1 EDTA, 0.5 mmol l−1 EGTA, 0.1% DOC and 0.5% N-lauroylsarcosine with 0.1 mmol l−1 PMSF and the EDTA-free protease inhibitor cocktail). Cells were sonicated using a Branson Sonifier 250 for four cycles of 10 s on and 50 s off. Next, 30 μl of 10% Triton X-100 was added to each tube and then samples were centrifuged at maximum speed for 15 min at 4 °C. Antibody–bead conjugate solution (50 μl) was added to the supernatant, and chromatin was immunoprecipitated overnight on a rotator at 4 °C. The following washes were performed: ChIP lysis buffer, ChIP lysis buffer + 0.65 mol l−1 NaCl, wash buffer (10 mmol l−1 Tris-HCl, pH 8.0, 250 mmol l−1 LiCl, 0.5% NP-30, 0.5% deoxycholate and 1 mmol l−1 EDTA, pH 8.0) and TE (10 mmol l−1 Tris-HCl, pH 8.0, and 1 mmol l−1 EDTA, pH 8.0). DNA was eluted with TES (50 mmol l−1 Tris-HCl, pH 8.0, 10 mmol l−1 EDTA, pH 8.0, and 1% SDS) for 30 min at 65 °C. Reversal of crosslinking was performed by incubating samples overnight at 65 °C. Proteins were digested using 1 mg ml−1 proteinase K and incubating at 37 °C for 5 h. Finally, the DNA was purified using a Wizard SV Gel and PCR Clean Up Kit (Promega). Immunoprecipitated DNA was analysed by quantitative PCR using iTaq Universal SYBR Green Supermix (Bio-Rad) using primer 4 (ref. 28): forwards, CCACCTGACGTCTAAGAAACCAT; reverse, GATCCCTCGAGGACGAAAGG. Conditions for amplification were: 5 min at 95 °C, 40 cycles of 95 °C for 10 s and 30 s with 62 °C annealing temperature. The percentage input was calculated using the following formula: percentage \(\mathrm{input}=100\times {2}^{(\mathrm{adjustedinput}-{\mathrm{Ct}}_{\mathrm{IP}})}\), where adjustedinput = Ct input − 6.664, and CtIP indicates the threshold cycle value of the immunoprecipitated DNA.
TMAs
Two TMAs were used. TMA 1 is a tissue microarray comprising serous tumours from ovarian cancer patients treated at the University of Colorado and was constructed as previously described61,62. Samples were collected under a University of Colorado institutional review board (IRB)-approved protocol (COMIRB #17-7788). The generation of the TMA was retrospective and patient information was de-identified, so a written informed consent was not required as deemed by COMIRB, as per the ethical standard defined by the Declaration of Helsinki. The TMA consisted of 109 primary tumours collected before chemotherapy, 19 primary tumours collected after chemotherapy, and 28 recurrent tumours that were subsequently treated with second-line chemotherapy. The time range of recurrence was 8–81 months. All tumours are shown in Fig. 5. A Kaplan–Meier survival curve was generated by correlating scores to PFS. Only recurrent patients were used for this analysis.
TMA 2 was received from the Cooperative Human Tissue Network (CHTN; CHTN OvCa2- Ovarian Carcinoma Survey). Only serous tumours were used for the analyses in this study.
Patient serum samples and outcomes data
Pretreatment (pre-surgery and pre-chemotherapy) blood was collected from patients with newly diagnosed epithelial ovarian cancer under University of Pittsburgh approved IRB protocols 20050019, 19070449 and 19060197. All participants were thoroughly briefed on the study and provided written informed consent. Inclusion criteria consisted of newly diagnosed, pathologically confirmed epithelial ovarian cancer, an age of 18 years or older, the ability to provide informed consent, willingness to provide access to medical records, undergoing interval or primary debulking surgery at UPMC/HCC, completing a full course (six cycles) of platinum-based chemotherapy at UPMC/HCC and willingness to provide biospecimens for banking purposes. Patients with a prior history of any cancer and those who had initiated any chemotherapy before enrolment were excluded from ProMark. Blood was collected in red-top tubes, centrifuged at 500g for 10 min and serum was aliquoted into cryopreservation tubes and stored at −80 °C until shipped to Metabolon for metabolomics analysis. Samples were shipped in a single batch to Metabolon to assess metabolite levels using the DiscoveryHD4 platform, which accurately identifies and quantitates more than 1,000 metabolites with less than 5% process variability using 100 µl of serum63. Samples were characterized using three independent platforms: ultrahigh-performance liquid chromatography with tandem mass spectrometry (UPLC–MS/MS) in the negative-ion mode, UPLC–MS/MS in the positive-ion mode and gas chromatography–mass spectrometry (GC–MS) after sialylation. Compounds were identified on the basis of chromatographic properties and mass spectra by comparing with a metabolomic library of purified standards.
Clinical data were extracted from the electronic medical. All patient primary diagnosis slides were reviewed by a single pathologist (E.E.) to confirm primary epithelial ovarian cancer diagnosis. Only patients completing a full course of primary platinum-based chemotherapy were included in this study.
Quantification and statistical analysis
GraphPad Prism v.10.0 and Rstudio (v.2023.09.1) were used to perform statistical analysis. Outliers were removed using PRISM outlier analysis (ROUT method). For cell culture experiments, sample sizes were not chosen on the basis of statistical methods. Sample sizes were chosen on the basis of extensive experience with the assays we have performed. Immunofluorescence analysis was done in a blinded way when possible, as was analysis of metabolomics experiments. This was not possible for the in vitro and in vivo studies, as these experiments were performed by individual investigators who were aware of the experimental groups and treatment outcome. Samples that did not correctly inject, judged by lack of signal for the internal standard, on the MS were also omitted from analysis. Mice that were euthanized before the study’s end point were also excluded from analyses. When comparing two groups, an unpaired, two-sided Student’s t-test was performed. When comparing the means of multiple groups to selected groups, a one-way ANOVA followed by post-hoc Šídák tests was applied. Time-to-event end points were assessed using the Kaplan–Meier method for visualization and the log-rank test for comparison. Also, Cox proportional hazards regression models were fit to evaluate continuous metabolite measurements, as well as to adjust for outcome-related covariates. P values are indicated in the figures. Heatmaps were generated using GraphPad Prism.
Reporting summary
Further information on research design is available in the Nature Portfolio Reporting Summary linked to this article.

