


Ethical compliance
Animal studies were performed at the Washington University School of Medicine in compliance with institutional guidelines and protocols approved by the Institutional Animal Care and Use Committee (animal protocol 21-0087, 24-0274; IBC protocol 13652, principal investigator: P.M.R.P.). Radiolabelling and PET–CT imaging experiments were performed using appropriately shielded equipment within a licensed radiation-safety facility by trained personnel under an active licence.
Preparation of antibody–TCO and antibody–tetrazine conjugates (random and site-specific)
Random conjugation
Antibodies were conjugated at a molar ratio of 15 TCO-PEG4-NHS-ester (TCO; BroadPharm, BP-22418) or tetrazine-PEG5-NHS-ester (tetrazine: BroadPharm, BP-22681) per antibody. Conjugations were performed in PBS (pH 8.8–9) at 37 °C, 500 rpm for 1 h. Conjugates were purified using a desalting column (PD-10, GE Healthcare) and concentrated using Amicon filters with a 50 kDa molecular weight cutoff (Millipore, UFC8050) in 1× PBS (pH 7.4).
For indocyanine green-Sulfo-Osu (ICG) conjugation, trastuzumab–tetrazine was conjugated with ICG (Fisher Scientific, 501952790) at a molar ratio of 3 ICG per antibody in PBS (pH 8.8) at 37 °C, 500 rpm for 1 h. The fluorescently labelled antibody conjugate was purified using a desalting column (PD-10) and concentrated using 50 kDa molecular weight cutoff Amicon filters in 1× PBS (pH 7.4).
Site-specific conjugation
Antibodies were modified with azide groups through the glycosylation sites in the Fc region (SiteClick Antibody Azido Modification kit, ThermoFisher, S10901). In brief, antibodies (5 mg) were incubated with 100 µl β-galactosidase at 37 °C, 450 rpm for 6 h, followed by overnight incubation at 30 °C with UDP-GalNAz containing GalT enzyme. Azide-modified antibody was purified and concentrated using Amicon filters with a 50 kDa molecular weight cutoff in 1× Tris buffer (pH 7.0). Then, DBCO-PEG12-TCO (TCO; BroadPharm, BP-22423) or DBCO-methyl-tetrazine (tetrazine; Vector Laboratories, CCT-1022) at a molar ratio of 15 was conjugated with the azide-modified antibody overnight at room temperature. Site-specific conjugates were purified using a desalting column (PD-10) and concentrated with Amicon filters with a 50 kDa molecular weight cutoff in 1× PBS (pH 7.4).
The concentration of the antibody conjugates was determined using a UV-visible spectrophotometer or a Pierce 660 assay (Thermo Fisher Scientific, 22660).
Cell culture
The human cancer cell lines NCIN87, A431, BT474, CT26, MDAMB231, MIAPaCa-2 and JIMT1 were purchased from the American Type Culture Collection (ATCC). All cell lines used were tested for bacterial contamination with a PlasmoTest mycoplasma detection kit (InvivoGen, rep-pt1) and authenticated by STR DNA profiling before cell or animal studies. Cells were cultured at 37 °C in a humidified atmosphere at 5% CO2. All cell culture media were supplemented with 100 units ml−1 penicillin and streptomycin. Details of cell culture media for respective cell lines are detailed in Supplementary Table 3. Different cancer cell lines were used for PET and therapeutic studies, as summarized in Supplementary Table 4.
Generation of CT26-hHER2 and BT474 trastuzumab-resistant cell lines
We used our previously reported methods to develop the CT26-hHER2 cell line3. In brief, we transduced the mouse cancer cell line CT26 using 8 g ml–1 hexadimethrine bromide (Sigma), and the medium was changed 24 h later. Puromycin selection (5 μg ml–1) was initiated 3 days after transduction and was continued for a minimum of 4 days afterwards. Western blot analysis confirmed human HER2 (hHER2) expression in the CT26 cells (Supplementary Fig. 7). HER2 expression in CT26-hHER2 tumours was also confirmed by IHC (Extended Data Fig. 2c). PET–CT imaging and ex vivo biodistribution analyses using radiolabelled anti-HER2 trastuzumab confirmed trastuzumab uptake in CT26-hHER2 cells implanted in the mouse (Extended Data Fig. 2a,e).
BT474 human breast cancer cells were made resistant to trastuzumab by continually incubating the parental BT474 cancer cells with increasing concentrations (up to 15 μg ml–1) of the trastuzumab antibody over a period of 9 months. Cell viability studies indicated >90% viability at 48 h after incubation of cells with 20 nM trastuzumab, thereby confirming resistance.
SDS–PAGE, MALDI, SEC–HPLC and TEM
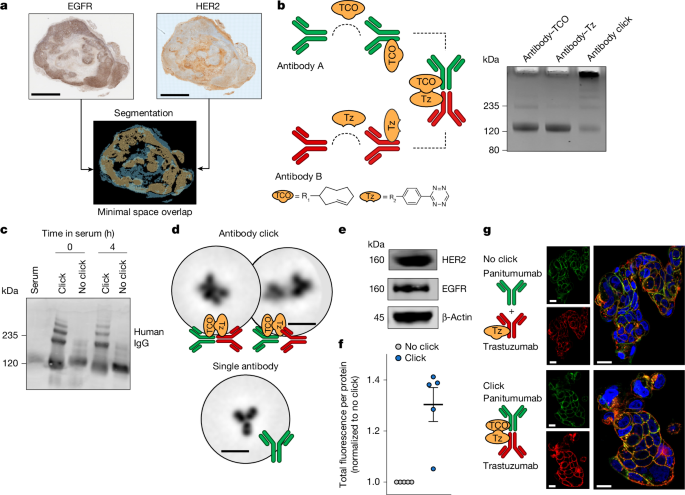
For antibody click validation, antibody–TCO and antibody–tetrazine were incubated at a 1:1 reaction ratio at 37 °C, 450 rpm for 90 min. The antibodies (10 µg) were then mixed with loading buffer (Laemmli buffer), loaded in SDS–PAGE gels (NuPage 4–12% Bis-Tris protein gels, Invitrogen) and subjected to standard gel electrophoresis. For reducing conditions, samples were mixed with loading buffer containing reducing agent and boiled at 95 °C for 10 min. After SDS–PAGE, the gels were rinsed with deionized water, stained using a Pierce Mini Gel Power Staining kit (ThermoFisher, 2284) and scanned on an Odyssey CLx imaging system (LI-COR). No-click reactions (antibody plus antibody–tetrazine), single antibodies and modified antibodies were used as controls.
For ICG studies, trastuzumab–TCO and trastuzumab–tetrazine–ICG were incubated at different ratios (1:1, 1:0.8, 1:0.6, 1:0.4 and 1:0.2) at 37 °C, 450 rpm for 90 min. Additional experiments were conducted in 1:1 reaction ratios at 37 °C, 450 rpm, at different incubation times (1, 10, 30 and 90 min). To block the click reactions, 15 µg trastuzumab–TCO or trastuzumab–tetrazine was pre-incubated with 0.5 µg unconjugated tetrazine or TCO, respectively. Pre-incubation was performed at 37 °C, 450 rpm for 90 min. After pre-incubation, the antibody click pairs were reacted in a 1:1 molar ratio for 90 min. Samples were analysed by SDS–PAGE as described above.
Matrix-assisted laser desorption/ionization-time of flight (MALDI-TOF) mass spectrometry of the antibody conjugates was performed to determine the number of conjugates per antibody at the Alberta Proteomics and Mass Spectrometry Facility at the University of Alberta in Canada.
Size-exclusion chromatography–high performance liquid chromatography (SEC–HPLC) was performed using an Agilent 1260 Infinity II and a Biozen 3 µm dSEC-2 column (200 Å, 300 × 7.8 mm, Phenomenex). A flow rate of 1 ml min–1 was used with a mobile phase of PBS buffer for 15 min. Samples were detected at 280 nm. Data collection and analyses were performed using Laura software (LabLogic).
TEM of the antibodies was performed at the Washington University Center for Cellular Imaging. In brief, 20 µl trastuzumab (single antibody) or click trastuzumab–TCO plus trastuzumab–tetrazine samples (10 µg ml–1 in mQ water; random and site-specific) were adsorbed for 60 s onto carbon-coated 200 mesh copper grids (01840-F, Ted Pella), which had been glow-discharged for 30 s in a Solarus 950 plasma cleaner (Gatan). After sample adsorption, the grids were washed 5 times with ultrapure water and stained for 2 min with freshly prepared 0.75% uranyl formate. Excess stain was blotted off using filter paper (Whatman no. 2, Fisher Scientific) before air drying. Grids were imaged using a JEOL JEM-1400Plus microscope (JEOL) at an operating voltage of 120 kV with a NanoSprint15-MkII 16-megapixel sCMOS camera (Advanced Microscopy Techniques). For 2D classification analysis, images were collected at a nominal magnification of ×30,000, which corresponded to a pixel size of a 3.54 Å. Data processing was done with Relion 3.1 (PMID: 30412051). In brief, particles were picked using Laplacian-of-Gaussian blob detection and then extracted with box sizes of 128 or 250 pixels for the single antibody and click samples, respectively. Particles underwent multiple rounds of 2D classification, and the clearest classes were selected for display.
Western blot analyses
Western blot of tumour and cell lysates was performed using our previously reported methods3. Primary antibodies included rabbit anti-HER2 (1:800; ab131490, Abcam), rabbit anti-EGFR (1:1,000; ab52894, Abcam), mouse anti-β-actin (1:10,000; A1978, Sigma), DM1 monoclonal antibody (1:1,000; Invitrogen, MA5-42528) and anti-trastuzumab antibody (2.5 µg ml–1; Biotechne, MAB95471-SP). After overnight incubation with the primary antibodies at 4 °C, membranes were washed 3 times with Tris-buffered saline containing Tween-20 buffer (TBS-T) with gentle agitation and then incubated with the following secondary antibodies for 1 h at room temperature: anti-rabbit goat IgG conjugated with Alexa Fluor 680 (1:10,000; Invitrogen, A-21076), anti-mouse goat IgG conjugated with Alexa Fluor 800 (1:10,000; Invitrogen, A32730) and anti-human goat IgG conjugated with Alexa Fluor 680 (1:1,000, ThermoFisher, SA000069). Membranes were washed three times and scanned using an Odyssey CLx imaging system (LI-COR). Western blot source data are provided in Supplementary Fig. 1.
IgG–DM1 preparation
Human IgG isotype control (Invitrogen, 31154) was conjugated to SMCC-DM1 (MedChemExpress, HY-101070) at a 1:5 molar ratio in PBS (pH 8.7) at 37 °C, 500 rpm for 1 h. The resulting IgG–DM1 conjugate was purified using a desalting column (PD-10) and concentrated using an Amicon filter with a 50 kDa molecular weight cutoff in 1× PBS (pH 7.4).
To validate the conjugation of IgG to DM1, IgG and IgG–DM1 were run on a SDS–PAGE gel (Invitrogen) and then transferred to a polyvinylidene difluoride membrane (iBlot, Invitrogen) using an iBlot 2 Gel transfer system (Invitrogen). The membrane was washed and stained with an anti-DM1 monoclonal antibody. Before analysis, the gel was stained using a Pierce Mini Gel Power Staining kit. Protein bands were imaged using an Odyssey CLx imaging system (LI-COR). Western blot source data are provided in Supplementary Fig. 1.
For the generation of IgG–DM1–tetrazine, IgG–DM1 was conjugated to tetrazine–PEG5-NHS-ester as described for the antibody–tetrazine random conjugation procedure.
In-cell western assay
NCIN87 cancer cells (24,000 cells per well) were plated in a 96-well plate and incubated at 37 °C in 5% CO2. After 24 h, the cells were fixed with 4% (v/v) paraformaldehyde (PFA) at room temperature for 20 min, washed with PBS and permeabilized with 0.25% Triton X-100 prepared in PBS containing 0.02% BSA and 0.02% NaN3. The NCIN87 cells were blocked with 1% BSA prepared in PBS containing 0.02% BSA and 0.02% NaN3 at room temperature for 30 min and incubated at 4 °C overnight with trastuzumab, trastuzumab–tetrazine, trastuzumab–ss-tetrazine, panitumumab, panitumumab–TCO or panitumumab–ss-TCO. All antibodies were prepared at 100 nM in 1% BSA in PBS. Cells were washed with PBS, followed by incubation with anti-human goat IgG conjugated with AlexaFluor 680 (1:1,000; ThermoFisher, SA000069) at room temperature for 1 h. The plates were scanned using an Odyssey CLx imaging system (LI-COR), and quantifications were performed using Empiria Studio software (v.3.2).
In vitro serum reactivity of antibody click pairs
Panitumumab–TCO or trastuzumab–tetrazine was incubated in mouse serum (Sigma-Aldrich, M5905) at a final concentration of 5 mg ml–1 in a 1:1 mixture (PBS to mouse serum) at 37 °C, 500 rpm for 0, 4 or 24 h. At each time point, 5 µg of the corresponding antibody was collected and reacted with its complementary click pair in PBS (20 µl) at 37 °C, 500 rpm for 90 min. For the no-click group, unmodified panitumumab was used.
To evaluate antibody click reactivity following incubation in mouse serum, click and no-click reaction samples were analysed by SDS–PAGE and transferred onto polyvinylidene difluoride membranes as described above (see the section ‘IgG–DM1 preparation’). Membranes were washed in TBS-T and stained with revert 700 total protein (LI-COR, 92611016) according to the manufacturer’s instructions. Membranes were then incubated with anti-human goat IgG conjugated with Alexa Fluor 680 (1:5,000) in 5% BSA in TBS-T at room temperature for 1 h. Following washing, images were acquired using an Odyssey CLx imaging system (LI-COR). Western blot source data are provided in Supplementary Fig. 1.
Immunofluorescence
For immunofluorescence assays, TCO-conjugated or tetrazine-conjugated antibodies were labelled with Alexa Fluor 488 NHS ester (Thermo Fisher Scientific, A20000) or Alexa Fluor 594 NHS ester (Thermo Fisher Scientific, A20004) at a molar ratio of 4 fluorophores per antibody at 37 °C, 450 rpm for 1 h in PBS (pH 8.8). The fluorescently labelled antibody conjugates were purified via desalting chromatography (PD-10) and concentrated using 50 kDa molecular weight cutoff Amicon filters in 1× PBS (pH 7.4). For control studies, unconjugated antibodies were labelled with Alexa Fluor 488 NHS ester.
Confocal microscopy
NCIN87 and MIAPaCa-2 cancer cells (1 million cells) were grown on coverslips of 1.5 mm thickness (ThermoFisher Scientific, 12-542B) pretreated with poly-l-lysine (Sigma-Aldrich) for 24 h. Cells were then first incubated with 100 nM panitumumab (no click) or panitumumab–TCO (click) conjugated with Alexa Fluor 488 in cell culture medium at 4 °C for 30 min. Next, the cells were washed to remove unbound antibodies with PBS (containing Ca2+ and Mg2+, DPBS) and incubated with 100 nM trastuzumab–tetrazine conjugated with Alexa Fluor 594 in cell culture medium at 37 °C in 5% CO2 for 3 or 24 h. Cells were then washed with PBS and fixed with 4% PFA for 20 min at room temperature before incubation with 4′,6-diamidino-2-phenylindole (DAPI; 1:5,000, Santa Cruz Biotechnology) for 5 min. Fluorescence images were acquired using a ×63 oil-immersion objective using a Zeiss 980 microscope (excitation at 488, 561 and 405 nm, and emission at 499–570, 577–642 and 420–478 nm) at the Washington University Center for Cellular Imaging.
For studies in which pertuzumab was used as the first pair of antibody click, the experimental procedure was performed in NCIN87 cancer cells as described above, but replacing panitumumab or panitumumab–TCO with pertuzumab or pertuzumab–TCO conjugated with Alexa Fluor 488, respectively.
Experiments of LAMP1 staining were performed after 3 h of incubation with trastuzumab–tetrazine conjugated with Alexa Fluor 594, as described above. Then, cells were fixed with 4% PFA for 20 min at room temperature, permeabilized for 5 min with 0.2% Triton X-100 prepared in PBS containing 0.02% BSA and 0.02% NaN3 and blocked with 1% BSA in TBS-T for 30 min at room temperature. Cells were incubated with CoraLite Plus 647 anti-human CD107a/LAMP1 (1:400; Proteintech, CL647-65051) for 1 h at room temperature. Fluorescence images were acquired using a ×63 oil-immersion objective using a Zeiss 980 microscope (excitation 639 nm, and emission 660–750 nm) at the Washington University Center for Cellular Imaging.
Immunofluorescence with site-specific conjugations was performed in MIAPaCa-2 cancer cells as described above, but incubating trastuzumab–ss-tetrazine for 1 h at 37 °C in 5% CO2. For the pre-click condition, panitumumab–ss-TCO conjugated with Alexa Fluor 488 and trastuzumab–ss-tetrazine conjugated with Alexa Fluor 594 were reacted for 90 min at 37 °C at a 1:1 molar ratio before incubation with cells. Fluorescence images were acquired using a ×60 oil-immersion objective using an EVOS M5000 imaging system (excitation at 482 and 585 nm, and emission at 524 and 628 nm).
Fluorescence quantification
NCIN87 (20,000 cells) and MIAPaCa-2 (15,000 cells) cancer cells were plated in a 96-well plate and incubated at 37 °C in 5% CO2. After 24 h, the cells were first incubated with 100 nM panitumumab (no click) or panitumumab–TCO (click) conjugated with Alexa Fluor 488 in culture medium at 4 °C for 30 min. Next, the cells were washed with PBS (containing Ca2+ and Mg2+, DPBS) and incubated with 100 nM trastuzumab–tetrazine conjugated with Alexa Fluor 594 in culture medium at 37 °C in 5% CO2 for 3 h. Cells were then washed with PBS, and fluorescence intensity (excitation at 488 and585 nm, emission at 530 and 626 nm) was measured using a BioTek Synergy H1 microplate reader (Agilent). Protein quantification was performed by lysing the cells in PBS containing 1% (m/v) SDS and measured by BCA assay.
pHrodo internalization assay
Trastuzumab–tetrazine was labelled with the amine-reactive pHrodo Red (ThermoFisher, P36600) according to the manufacturer’s instructions at a molar ratio of 19:1 (dye to antibody). In brief, trastuzumab–tetrazine in 0.1 M NaHCO3 (pH 8.3) was incubated with pHrodo red succinimidyl ester at room temperature for 1 h. The resulting conjugate was purified using Zeba spin desalting column (7 K MWCO, 0.5 ml, ThermoFisher, 89882) in 1× PBS pH 7.4. For control, IgG–tetrazine was conjugated to pHrodo Red succinimidyl ester.
NCIN87 (24,000 cells), MIAPaCa-2 (15,000 cells), MDA-MB-231 (15,000 cells), CT26 (15,000 cells) and CT26-hHER2 (15,000 cells) cancer cells were plated in a 96-well plate and incubated at 37 °C in 5% CO2. After 24 h, the cells were first incubated with 5 µg ml–1 panitumumab (no click) or panitumumab–TCO (click) in cell culture medium at 4 °C for 30 min. Next, the cells were washed with PBS (containing Ca2+ and Mg2+, DPBS) and incubated with 5 µg ml–1 trastuzumab–tetrazine conjugated with pHrodo. Live-cell imaging was performed on an IncuCyte S3 (excitation at 565–605 nm, emission at 625–705 nm) under a ×10 objective at an interval of 1 h at 37 °C at the Siteman Flow Cytometry Core. For pHrodo assays with site-specific conjugates, the procedure was performed as described above, using 10 µg ml–1 of the corresponding antibodies. Data were collected at an interval of 2 h at 37 °C.
IHC and co-registration
IHC staining of HER2 and EGFR was performed on formalin-fixed, paraffin-embedded sections (4 µm) of NCIN87, A431, MIAPaCa-2, admix model and CT26-hHER2 subcutaneous tumours. For paraffin-embedding and sectioning, tumours were submitted to the Pulmonary Morphology Core at Washington University School of Medicine. For NCIN87, A431 and MIAPaCa-2 tumours, sections were submitted to HistoWiz for HER2 and EGFR staining. For the admixed tumours, EGFR IHC was performed by HistoWiz, and HER2 by the Anatomic and Molecular Pathology core laboratory. For CT26-hHER2, sections were submitted to the Laboratory of Comparative Pathology at Memorial Sloan Kettering Cancer Center for HER2 staining.
To assess how EGFR and HER2 proteins are distributed across the same tumour tissue, we used automated image analysis58. First, we digitally aligned (co-registered) the stained tissue images by enhancing contrast, reducing background noise and matching key tissue structures between the two. This process ensured that the same regions of tissue could be directly compared. Next, we segmented each image to isolate the areas with the highest levels of protein staining. This step involved identifying and highlighting distinct regions corresponding to high EGFR or HER2 signals. Together, these steps enabled us to quantify and visualize the extent to which the two proteins overlapped in each tumour via DSC. Additional details involving the co-registration methods are provided in Supplementary Information.
Antibody radiolabelling
Antibodies used in this work were radiolabelled with 89Zr or 64Cu according to published methods38,59. 89Zr and 64Cu were purchased from the WUSTL Cyclotron and Nuclear Pharmacy. In brief, antibodies were first conjugated with the chelators p-isothiocyanatobenzyl-desferrioxamine (DFO-Bz-NCS; Macrocyclics) or 2-S-(4-isothiocyanatobenzyl)-1,4,7-triazacyclononane-1,4,7-triacetic acid (p-SCN-Bn-NOTA, Macrocyclics) and then radiolabelled with 89Zr or 64Cu, respectively. Antibodies were purified after conjugation and radiolabelling using desalting columns (PD-10) and concentrated using Amicon filters with a 50 kDa molecular weight cutoff. Radiolabelled antibodies used in the study had a radiochemical yield and purity above around 95%.
For bispecific antibody radiolabelling, BSCFV-155 (Creative Biolabs; anti-EGFR based on clone C225 and anti-HER2 based on clone 4D5) was conjugated with p-SCN-Bn-NOTA and radiolabelled with 64Cu as previously described59. Serum stability was performed following a previously described method59. In brief, 10 µCi (0.37 MBq) of the purified radiolabelled antibody was incubated with human serum at 37 °C for 48 or 72 h.
PET–CT imaging and biodistribution studies
Female nu/nu mice (6–8 weeks old) or female BALB/c mice (4–6 weeks old), purchased from Charles River Laboratories, were used for imaging studies. Tumour implantation and tumour models used are summarized in Supplementary Table 4. The tumour volume was estimated by external vernier caliper measurements of the longest axis, α (in mm), and the axis perpendicular to the longest axis, b (in mm). The tumours were assumed to be spheroidal, and the volume was calculated in accordance with the equation V = (4π/3) × (α/2)2 × (b/2). PET–CT imaging was performed when tumour volumes reached approximately 150–200 mm3.
For random conjugates, mice were first injected with TCO-conjugated antibodies (50 µg). At 24 or 48 h after injection, mice were injected with [89Zr]Zr-DFO-trastuzumab–tetrazine or [64Cu]Cu-NOTA-trastuzumab–tetrazine (7.4 MBq, 50 µg) and used for both biodistribution and PET–CT imaging studies. Control groups included 64Cu/89Zr-labelled trastuzumab (single antibody) or panitumumab–TCO plus [64Cu]Cu-NOTA-IgG–tetrazine (control IgG click). Acute biodistribution and PET–CT imaging studies were performed at 48 h or 24 h after tail vein injection of the tetrazine-conjugated radiolabelled antibodies.
For site-specific conjugations, mice were first injected with panitumumab–ss-TCO (50 µg). At 24 h after injection, mice were injected with [89Zr]Zr-DFO-trastuzumab–ss-tetrazine or [64Cu]Cu-NOTA-trastuzumab–ss-tetrazine (7.4 MBq, 50 µg). PET–CT images were acquired at 24 h for [64Cu]Cu-NOTA-trastuzumab–ss-tetrazine or at 24, 48, 72, 96 and 120 h for [89Zr]Zr-DFO-trastuzumab–ss-tetrazine. Acute biodistribution studies were performed at the last point of the PET–CT imaging study. Control groups included IgG–ss-TCO plus [89Zr]Zr-DFO–trastuzumab–ss-tetrazine (control IgG click) or antibodies pre-clicked (panitumumab–ss-TCO pre-clicked with [89Zr]Zr-DFO-trastuzumab–ss-tetrazine) before being injected.
Mice used for biodistribution studies were euthanized by controlled carbon dioxide overdose followed by cervical dislocation, and organs were collected and weighed. Radioactivity associated with each organ was assessed using a gamma counter (2480 Wizard, PerkinElmer) and quantified as a percentage of the injected dose per gram of the organ (%ID g–1).
PET–CT imaging was conducted in a Mediso nanoScan PET–CT scanner at 24–120 h after injection of the radiolabelled antibodies modified with or without tetrazine. The mice were anaesthetized by inhalation of 2% isoflurane (Baxter Healthcare) in an oxygen gas mixture 5 min before the PET–CT experiments. CT scanning was recorded for 5 min to obtain anatomical information, followed by a static PET scan for 20 min. PET–CT images were analysed using Imalytics Preclinical software (v.3.1, Gremse-IT). PET–CT images were calibrated as a percentage of injected dose per millilitre (%ID ml–1). Regions of interest were delineated in the tumour, and activity values were obtained as mean %ID ml–1.
In vivo pharmacokinetic studies
Female and male nu/nu mice (4–5 weeks old; n = 12) or female BALB/c mice (4–5 weeks old; n = 7) were obtained from Charles River Laboratories. Mice were intravenously injected with 5 mg kg–1 panitumumab–TCO (nu/nu mice) or pertuzumab–TCO (BALB/c mice). At 24 h after injection, the mice received a second intravenous injection of 5 mg kg–1 trastuzumab–tetrazine. Blood samples were collected by cardiac puncture at 5 min, 30 min, 4 h, 16 h and 24 h after administration of trastuzumab–tetrazine, after euthanizing the mice. Blood was coagulated at room temperature for 30 min, and serum was obtained after centrifugation at 2,000g at 4 °C for 15 min. Then, 1 µl serum was diluted with 14 µl PBS and 5 µl loading buffer (Laemmli buffer), subjected to SDS–PAGE electrophoresis and western blot analyses. Membranes were stained with revert 700 total protein, anti-human goat IgG conjugated with AlexaFluor 680 (1:5,000) and anti-trastuzumab antibody (2.5 µg ml–1, Biotechne, MAB95471-SP) in 5% BSA in TBS-T. Protein bands were visualized using an Odyssey CLx imaging system. Western blot source data are provided in Supplementary Fig. 1.
Antibody–ADC click therapeutic efficacy studies (random and site-specific)
Female and male nu/nu mice (6–8 weeks old) or female BALB/c mice (4–6 weeks old) were obtained from Charles River Laboratories. Information regarding tumour models is provided in Supplementary Table 4. Tumour volumes were measured twice a week by external caliper measurements of the longest axis, α (in mm), and the axis perpendicular to the longest axis, b (in mm). The tumours were assumed to be spheroidal, and the volume was calculated in accordance with the equation V = (4π/3) × (α/2)2 × (b/2). Once tumour volumes reached 100–250 mm3, ADC treatments were initiated, and doses were selected on the basis of commonly used preclinical dosing ranges for ADC studies, including those reported for T-DXd in mouse tumour models4,5,60,61. Humane end points were defined as tumour volumes >1,500 mm3, body-weight loss of >20%, tumour ulceration and other clinical symptoms of acute toxicity. At the terminal stage, selected tumours were collected for western blot analyses. Stratified random sampling was used to assign the mice randomly to experimental or control groups to ensure comparable tumour size at baseline. The personnel involved in tumour measurements and mouse weight were blinded to the treatment groups.
Gastric cancer model (NCIN87)
Female or male nu/nu mice inoculated with NCIN87 xenografts were stratified into the following two groups: no click (panitumumab plus T-DXd; n = 6) or click (panitumumab–TCO plus T-DXd–tetrazine; n = 6). Panitumumab or panitumumab–TCO was administered at 10 mg kg–1 via the tail vein. At 24 h after injection, the mice received an intravenous injection of T-DXd or T-DXd–tetrazine (10 mg kg–1).
Bilateral tumour model
Female and male nu/nu mice were subcutaneously injected with NCIN87 and A431 cancer cells inoculated in the right and left flanks, respectively. Mice were randomized into three groups: saline (n = 5), no click (panitumumab plus T-DXd, n = 9) or click (panitumumab–TCO plus T-DXd–tetrazine, n = 9). Panitumumab or panitumumab–TCO was administered at 5 mg kg−1 via the tail vein. At 24 h after injection, mice received an intravenous injection of T-DXd or T-DXd–tetrazine (5 mg kg–1).
NCIN87 gastric cancer model of acquired resistance to T-DXd
Male and female nu/nu mice inoculated with NCIN87 xenografts (n = 16) were treated with T-DXd monotherapy intravenously (5 mg kg–1). Nearly 1 month after therapy initiation, mice were stratified into responders versus non-responders on the basis of tumour volume measurements. Tumours from responder and non-responder tumours were subjected to western blot analyses and HER2-targeting PET imaging. Responder tumours were defined as having a fold change in tumour volume lower than or equal to 0 and a decrease in HER2 by PET. A fold change in tumour volume for non-responders was close to 1, and demonstrated an increase in EGFR protein levels as detected by western blotting. HER2-targeting immuno-PET was performed at 24 h after intravenous injection of [64Cu]Cu-NOTA-trastuzumab (50 µg, 7.4 MBq). The mice that initially did not respond to T-DXd therapy (non-responder) were treated intravenously with panitumumab–TCO (5 mg kg–1) on day 1 and with T-DXd–tetrazine on day 2 (5 mg kg–1).
BT474 trastuzumab-resistant model
Female nu/nu mice were subcutaneously implanted with oestrogen-receptor-positive BT474 trastuzumab-resistant cells (n = 10). Drinking water of mice was supplemented with 0.67 μg ml–1 β-oestradiol (Sigma) from 1 week in advance of tumour inoculation and continued until mice were killed. Fresh oestradiol-supplemented water was provided twice a week. T-DXd monotherapy (5 mg kg–1) was initiated when the tumour volume reached 200–500 mm3. Nearly 1 month after therapy initiation, mice were stratified into responders versus non-responders on the basis of tumour volume measurements. Non-responder mice were treated with pertuzumab–TCO (5 mg kg–1) on day 1. Mice were then injected with T-DXd–tetrazine (5 mg kg–1) on day 2, and tumour volumes were measured twice a week.
Immunocompetent CT26-hHER2 model
Female BALB/c mice were subcutaneously injected with CT26-hHER2 cancer cells. Mice were randomized into five cohorts: saline (n = 7), pertuzumab (n = 9), T-DXd (n = 9), no click (pertuzumab plus T-DXd, n = 14) or click (pertuzumab–TCO plus T-DXd–tetrazine, n = 14). Pertuzumab or pertuzumab–TCO was administered at 5 mg kg–1 via the tail vein. At 24 h after injection, mice received an intravenous injection of T-DXd or T-DXd–tetrazine (5 mg kg–1). For individual antibodies (pertuzumab or T-DXd), animals received a single dose at 5 mg kg–1.
Admixed breast tumour model (random and site-specific)
Female mice (nu/nu) inoculated with admixed breast tumour (MDA-MB-231 plus JIMT1) xenografts were divided into nine groups: saline (n = 10), panitumumab (n = 10), T-DXd (n = 10), T-DM1 (n = 10), T-DXd no click (panitumumab plus T-DXd, n = 10), T-DM1 no click (panitumumab plus T-DM1, n = 10), T-DXd click random (panitumumab–TCO plus T-DXd–tetrazine, n = 14), T-DXd click site-specific (panitumumab–ss-TCO plus T-DXd–ss-tetrazine, n = 10) or T-DM1 click random (panitumumab–TCO plus T-DM1–tetrazine, n = 6). The admixed breast tumour model was developed by co-injecting HER2+ JIMT1 and HER2– MDA-MB-231 breast cancer cells at a 4:1 ratio at the time of implantation. Panitumumab or panitumumab–TCO (random or site-specific) was administered at 5 mg kg–1 via the tail vein. At 24 h after injection, mice received an intravenous injection of 5 mg kg–1 T-DXd, T-DM1, T-DM1–tetrazine or T-DXd–tetrazine (random or site-specific). For individual antibodies (panitumumab, T-DM1 or T-DXd), animals received a single dose at 5 mg kg–1.
Pancreatic tumour model (random and site-specific)
Female or male mice (nu/nu) inoculated with MiaPaCa-2 pancreatic xenografts were divided into 13 groups: saline (n = 8), panitumumab (n = 10), T-DXd (n = 10), T-DM1 (n = 10), T-DXd no click (panitumumab plus T-DXd, n = 10), T-DM1 no click (panitumumab plus T-DM1, n = 10), T-DXd click random (panitumumab–TCO plus T-DXd–tetrazine, n = 10), T-DM1 click random (panitumumab–TCO plus T-DM1–tetrazine, n = 10), IgG–DM1 (n = 8), IgG–DM1 no click (panitumumab plus IgG–DM1, n = 6), IgG–DM1 click random (panitumumab–TCO plus IgG–DM1–tetrazine, n = 6), T-DXd click site-specific (panitumumab–ss-TCO plus T-DXd–ss-tetrazine, n = 10) or T-DXd click random in the presence of excess tetrazine (panitumumab–TCO plus T-DXd–tetrazine in the presence of 5 mg kg–1 NHS-PEG5-tetrazine). Panitumumab or panitumumab–TCO (random or site-specific) was administered at 5 mg kg–1 via the tail vein. At 24 h after injection, mice received an intravenous injection of 5 mg kg–1 T-DXd, T-DM1, T-DM1–tetrazine or T-DXd–tetrazine (random or site-specific). For individual antibodies (panitumumab, T-DM1, IgG–DM1 or T-DXd), animals received a single dose at 5 mg kg–1.
Toxicology studies
To assess the potential for antigen-independent toxicity, female BALB/c mice (n = 24) were purchased from Charles River Laboratories. For serum chemistry analyses, mice were randomized into four groups: saline (n = 7), no click (panitumumab plus T-DXd, n = 4), random click (panitumumab–TCO plus T-DXd–tetrazine, n = 3) or site-specific click (panitumumab–ss-TCO plus T-DXd–ss-tetrazine, n = 4). Panitumumab, panitumumab–TCO or panitumumab–ss-TCO was intravenously injected at 20 mg kg–1. At 24 h after injection, mice received an intravenous administration of T-DXd, T-DXd–tetrazine or T-DXd–ss-tetrazine (20 mg kg–1). Blood samples were analysed 15 days after administration of antibodies to measure the levels of enzymes associated with liver function, specifically AST, ALT and ALP.
For random and site-specific click groups (n = 3 per group), selected organs (lungs and liver) were collected and formaldehyde-fixed for histopathology 7 days after administration of antibodies. Liver and lung tissue slices were stained with haematoxylin and eosin. Damage was evaluated by microscopy by a board-certified pathologist at the Division of Comparative Medicine at Washington University as summarized in Supplementary Table 2.
Statistical analyses
Fluorescence quantification and biodistribution data were analysed using ANOVA followed by Student’s t-tests. These analyses were conducted using GraphPad Prism (v.9; www.graphpad.com) and R statistical (v.4.4.0) software.
Longitudinal PET image quantification data were analysed using a linear regression model with group, time and their interaction term. For tumour uptake (Extended Data Fig. 5b), for which the groups showed diverging accumulation rates over time, we used the emtrends function from the emmeans package to estimate the slope for each group and to perform pairwise contrasts of slopes with Tukey’s correction for multiple comparisons. This tests whether the temporal rate of antibody accumulation differs between groups. For liver uptake (Extended Data Fig. 5c), for which accumulation trajectories were roughly parallel across groups, we first confirmed that the group × time interaction term was not significant (F-test, P = 0.46) and then fit a no-interaction model. Group mean differences were estimated and compared using Tukey-adjusted pairwise contrasts from this model. For point comparisons at the 120 h end point cited in the main text, we fit a one-way linear model restricted to 120 h observations and obtained pairwise contrasts with Tukey’s correction (tumour) or a two-sample equal-variance t-test (liver, click versus pre-click).
For tumour volume comparison, the longitudinal data were analysed using a linear mixed-effects model with a first-order autoregressive (AR(1)) correlation structure to account for correlations among repeated measures from the same mouse. We included all time points at which every treatment group had data to perform balanced comparisons across groups. The mixed model included the treatment group, time points and the interaction term between group and time points. The P value of the interaction term from the type III (marginal) analysis was used to assess whether tumour volume fold change trajectories differed between treatment groups across time points. To quantify effect sizes, pairwise contrasts between each treatment group and the click group were estimated at the final common time point using the emmeans package (v.1.10.7), with Dunnett’s correction for multiple comparisons. Dunnett’s test was chosen over Bonferroni because it accounts for the positive correlation among contrasts that share a common reference group. As a pre-specified primary comparison, we also fit a separate model restricted to the click and no-click groups. This model used all time points at which both groups have data, extending the observation window beyond the final time point available in the full five-group model (which is constrained by the earlier dropout of control groups). Differences are reported on the fold change scale (relative to day 0 tumour volume) with 95% confidence intervals. Models were fit using restricted maximum likelihood via the nlme package (v.3.1-166) in R (v.4.4.0).
Survival was compared across treatment groups using the log-rank test. Pairwise comparisons between all group pairs were performed with Bonferroni correction for multiple testing. Hazard ratios with 95% confidence intervals were estimated using Cox proportional hazards regression. Kaplan–Meier survival curves were generated for visualization. All survival analyses were conducted using the survival package (v.3.5-8) at the two-sided 5% significance level.
Reporting summary
Further information on research design is available in the Nature Portfolio Reporting Summary linked to this article.

