


Data reporting
No statistical methods were used to predetermine sample size. The experiments were not randomized, and the investigators were not blinded to allocation during experiments and outcome assessment.
Mammalian cell culture
U2OS and HEK293T cells were maintained in Dulbecco’s modified Eagle’s medium (DMEM) with Glutamax (Gibco, 10566016), and MOLT4, Jurkat and NALM6 cells were maintained in RPMI-1640 medium with glutamine (Gibco, 11875093). The medium was supplemented with 10% fetal bovine serum (FBS; VWR, 89510-186) and 1× penicillin–streptomycin (Pen-Strep; Gibco, 15140122) at 37 °C and 5% CO2. The growth medium for PPAT-knockout cells was supplemented with 100 µM adenine. For drug treatment immunoprecipitation experiments, cells were plated in DMEM with Glutamax, 10% dialysed FBS (dFBS; Cytiva, SH30079.02) and 1× Pen-Strep. For metabolomics experiments, cells were plated in DMEM (high glucose, no glutamine; Gibco, 11960044) supplemented with 2 mM l-glutamine (Gibco, A2916801), 10% dFBS and 1x Pen-Strep. Further details about cell culture conditions for isotopic tracing experiments can be found under ‘Mass-spectrometry-based metabolomics’. Expi293F cells were maintained in Epxi293 medium (Gibco; A1435101) in shaker flasks at 130 rpm and 8% CO2. Cell stocks were obtained from and authenticated by (using short tandem repeat profiling) the University of California Cell Culture Facility (RRID: SCR_017924) and were routinely tested for mycoplasma contamination.
CRISPR editing and endogenous cell line generation
To generate CRISPR knockout NUDT5 and PPAT lines in HEK293T, Expi293F, MOLT4, Jurkat and NALM6 cells, we used a mixture of three optimized sgRNAs (Gene Knockout Kit v.2, Synthego). A total of 1.5 μl sgRNA mixture (100 μM) was incubated with 3.2 μl Cas9-NLS protein (40 μM; produced by the University of California, Berkeley (UC Berkeley) MacroLab) for 10 min at room temperature. Ribonucleoproteins (RNPs) were nucleofected into 5 × 10⁵ cells resuspended in Lonza SF solution (Lonza, V4XC-2032) using a Lonza 4D Nucleofector X-unit and pulse code CM-130 (HEK293T and Expi293F), CA-137 (MOLT4) or CM-138 (NALM6). Jurkat cells were nucleofected in Lonza SE solution (Lonza, V4XC-1032) using pulse code CL-120. Cells were recovered for 3-4 days, split once and then cloned by single-cell dilution in 96-well plates. Expi293F cells were not cloned, because NUDT5 bulk depletion was observed to be more than 95% by western blot. Clones were assessed for knockout by western blotting and phenotypic assay. Uncropped western blots and gels are included as Supplementary Fig. 1. To establish NUDT5-knockout lines used for experiments, five clones were combined at equal cell number into one pool to minimize clonal bias effects. A similar editing strategy was used for endogenous 3×Flag epitope tagging and NUDT5L217A/K218A mutant generation, except that a single sgRNA was used and 1 μl Alt-R HDR single-stranded oligodeoxynucleotide (ssODN) donor template (100 μM stock; IDT) was included in the nucleofection mixture added after RNP formation. For knock-in generation, cells were recovered in HDR Enhancer v.2 (IDT) for 16 h after nucleofection, followed by a change of medium. Knock-in clones were validated by Sanger sequencing. The sgRNA and ssODN sequences used are listed below:
sgRNA sequences: NUDT5 gene knockout (gKO) 1: 5′-CTTGCAGGTCTCATAGATGA-3′; NUDT5 gKO 2: 5′-ATCAATCCCTTCCCAGACGG-3′; NUDT5 gKO 3: 5′-ATACCAACCTGGAGAACATT-3′; PPAT gKO 1: 5′-TGATAGCAGTAGGACAATAA-3′; PPAT gKO 2: 5′-GTGTCTGATATAAATGACAA-3′; PPAT gKO 3: 5′-CATCTCTGTGCATTATAAGC-3′; NUDT5 endo-3×Flag: 5′-AATGGAGAGCCAAGAACCAA-3′; PPAT endo-3×Flag: 5′-TGTAGAATTAGAATGGTAGC-3′; NUDT5L217A/K218A: 5′-TGGGCTTAAAATTTCAAGAA-3′.
ssODN sequences: 3×FlagNUDT5: 5′-AACTTCTCACCTGAGGGCTGTAAAGACTCGTTTGAAAATGGACTACAAGGACCACGACGGCGATTATAAGGATCACGACATCGACTACAAAGACGACGATGACAAGGGTGGGAGTGGCGGGAGTGAGAGCCAAGAACCAACGGAATCTTCTCAGAATGGCAAACAGTATATCATTTC-3′; PPAT3×Flag: 5′-AGCTTGTCTCACTGGAAAATATCCTGTAGAATTAGAATGGGGTGGCAGCGGCGGTTCTGGTGGCAGCGACTACAAGGACCACGACGGCGATTATAAGGATCACGACATCGACTACAAAGACGACGATGACAAGTAGCTGGTAGGGTTGGATGTGTGTAGTTTCAAGATAGAAAG-3′; NUDT5L217A/K218A: 5′-TCGTTTACAAAAATGGCCAGTGTCATATTTGGGCTTAAAATGCAGCGAAGGGCACTTCAAATGGCTTTGCATTTGCATGTTTCAGT-3′.
Stable cell line generation
Lentiviral particles were generated by co-transfecting pLVX-IRES-puromycin or blasticidin constructs encoding the desired protein mutants with second-generation lentiviral packaging plasmids into HEK293T cells using Mirus Trans-IT LT1 transfection reagent (Mirus, MIR 2304). For FACS-based growth competition experiments, pLVX-mCherry-P2A-blasticidin and pLVX-GFP-P2A-blasticidin constructs were used to establish fluorescent cell lines for co-culture. After transfection of the plasmid mixture, the medium was changed the next day, and virus was collected 48 h after the medium change by filtering through a 0.45-µm filter. For stable cell line generation, cells were infected with lentiviral particles at a multiplicity of infection (MOI) < 1 in medium supplemented with polybrene (8 μg ml−1). Cells were selected with antibiotic (1 μg ml−1 puromycin or 10 μg ml−1 blasticidin) around 48 h after transduction until all cells on a control plate were dead, at which point selected cells were recovered without antibiotics for at least 2 days before assaying.
Metabolism-focused CRISPR screen
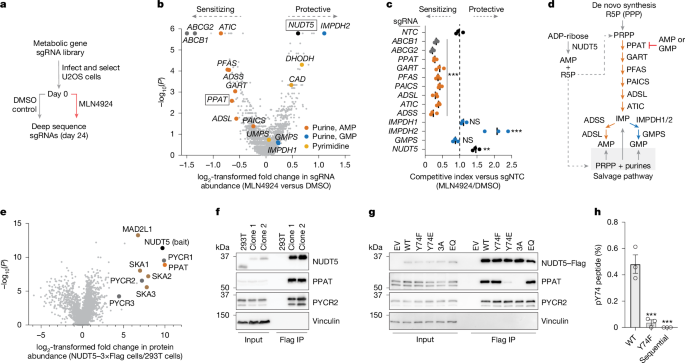
For the MLN4924 metabolism-focused CRISPR screen, we used a custom sgRNA library with 8 sgRNAs per gene targeting around 3,000 metabolic enzymes and transporters cloned into the pLentiCRISPR-V2 vector (a gift from K. Birsoy). Lentiviral particles were generated by co-transfecting the sgRNA library with third-generation lentiviral packaging plasmids into HEK293T cells using Mirus Trans-IT LT1 transfection reagent (Mirus, MIR 2304). U2OS cells grown in DMEM with Glutamax, 10% FBS and 1× Pen-Strep were transduced with lentivirus at an MOI of around 0.5 and 500-fold sgRNA coverage in medium supplemented with 8 μg ml−1 polybrene for 48 h. Transduced cells were selected with puromycin (1.5 μg ml−1) for 4 days, and recovered for an additional 2 days, after which a zero time point was collected for the screen (30 × 106 cells). The selected and expanded cells were split into two pools maintaining 1,000-fold sgRNA coverage throughout the screen and treated with either dimethyl sulfoxide (DMSO) or sublethal doses of MLN4924 (150 nM). Cells were split every 4 days, and fresh DMSO or MLN4924 was added after allowing cells to re-adhere to plates for 4 h. On day 24, 30 × 106 cells were collected per condition and genomic DNA was extracted using a QIAamp DNA Blood Maxi kit (QIAGEN, 51192) according to the manufacturer’s protocol. sgRNA-encoding regions were amplified with ExTaq DNA polymerase (Takara, RR001) with unique barcoded primers. PCR products were combined and 50 μl was gel purified from a 3% agarose TBE gel. Amplicons were sequenced using an Illumina NextSeq2000 by the UC Berkeley QB3 Genomics core facility. Data were analysed using the MAGeCK analysis package50, comparing normalized sgRNA representation on day 24 between DMSO- and MLN4924-treated cell pools.
For screen validation, competition experiments were performed as outlined in ‘Cellular growth assays’, with the following sgRNA sequences that were not present in the original metabolism-focused screening library:
NTC: 5′-GGCCGATAATGATCCGACCG-3′; ABCB1: 5′-TAGTAGGATTTACACGTGGT-3′; ABCG2: 5′-TTCTTGGATGAGCCTACAAC-3′; ADSL: 5′-CGAGCCAGTCTACCCACATT-3′; ADSS: 5′-TCAAGCAGCTGATGGTATCC-3′; ATIC: 5′-AAACCACGCTCGAGTGACAG-3′; GART: 5′-CGAGTACTTATAATTGGCAG-3′; GMPS: 5′-CGAACAGTTCCCTCACTCTT-3′; IMPDH1: 5′-ACACCCGGGACACGAGACGG-3′; IMPDH2: 5′-GCAGTGAAGTCGATGTACCC-3′; NUDT5: 5′-ACAGTTCCGACCACCAATGG-3′; PAICS: 5′-TACGAATTGTTAGACAGTCC-3′; PFAS: 5′-GCGGCACACTGACACGATGT-3′; PPAT: 5′-GTGATCACTCTGGGACTCGT-3′.
Cellular growth assays
All growth assays were conducted in DMEM with Glutamax supplemented with 10% FBS and 1x Pen-Strep. Specific drugs are noted under ‘Drugs and chemicals’ and amounts are specified in the figures and legends.
FACS-based growth competition
For growth competition experiments, GFP- or mCherry-expressing cell populations for comparison were established using lentiviral expression as described above. For CRISPR screening validation experiments, GFP-expressing U2OS cells were transduced with pLentiCRISPR-V2 lentivirus particles containing sgRNAs targeting the indicated genes (sgRNA sequences listed above) and an mCherry population was transduced with a non-targeting control sgRNA (sgNTC). After puromycin selection and recovery, GFP-knockout and mCherry-sgNTC cells were mixed in 12-well plates in equal cell number, and either DMSO or MLN4924 (100 nM) was added. Cells were split every 4 days, re-adding drug at each split. After 12 days, the ratio of GFP+ to mCherry+ cells was determined by flow cytometry using a BD LSRFortessa instrument and analysed using FlowJo (v.10.8.1). GFP+ to mCherry+ cell ratios for each knockdown competition condition in the presence of MLN4924 were normalized to equivalent DMSO-treated control conditions. The FACS gating strategy for growth competition experiments is outlined in Supplementary Fig. 2.
For drug treatment growth competition assays using HEK293T cells, GFP+ and mCherry+ cell populations were established as described above. For rescue experiments, NUDT5 was reintroduced to ΔNUDT5 cells by lentiviral expression using a pLVX-3×FlagNUDT5-IRES-puromycin construct as described above. In brief, 2.5 × 10⁴ wild-type HEK293T mCherry+ cells were co-plated with 2.5 × 10⁴ GFP+ cells in 12-well plates. The drug was added the following day, and cells were analysed by flow cytometry 72 h after addition. GFP+ to mCherry+ cell ratios for drug treatment wells were normalized to equivalent DMSO-treated cell mixtures.
CellTiter Glo
A total of 2.5 × 10³ U2OS cells were seeded in 96-well clear-bottom plates (Corning, 165306) in 50 μl medium. MLN4924 was added the following day at 2× concentration in 50 μl medium. Viability was measured after 72 h by the addition of 100 μl CellTiter Glo reagent per well (Promega, G7570) according to the manufacturer’s instructions, and a luminescence signal was measured on a Perkin Elmer EnVision microplate reader.
Incucyte
A total of 5 × 10³ HEK293T cells were seeded in black 96-well clear-bottom plates in 100 μl medium (Corning, 3904). Drugs were added the following day at 2× concentration in 100 μl medium. Cell growth was monitored using time-resolved microscopy in an Incucyte S3 microscope.
CellTiter Blue
Cells were seeded in black 96-well clear-bottom plates (Corning, 3904) at 20,000 cells per well (MOLT4 and Jurkat) or 15,000 cells per well (NALM6) in 50 μl RPMI-1640 medium supplemented with 10% FBS. HEK293T cells were seeded at 4,000 cells per well in DMEM with 10% FBS and allowed to attach for 24 h. 6-meTIMP (final concentration (Cf) = 0–25 μM) diluted in 50 μl of medium was added to the cells. A fully dead control treated with staurosporine (1 μM) was used for normalization in all assays. After 72 h of treatment, 20 μl of CellTiter Blue reagent (Promega, G8080) was added to each well. Plates were incubated at 37 °C and 5% CO2 for around 2 h, after which fluorescence signal was read using a PerkinElmer Envision microplate reader. Values for the dead control were subtracted from all wells, and raw data were normalized to the top values (Ymax) of the viability curve. Normalized data were plotted in GraphPad Prism (v.10) and fitted using the ‘[Inhibitor] versus response (four parameters)’ equation with top values fixed at 100% viability, and the bottom value was unfixed. Reported half-maximum inhibitory concentration (IC50) values are mean ± s.e.m. from n = 9 observations from 3 independent biological replicates.
Drugs and chemicals
The following drugs and chemicals were used in this study at amounts specified in figures and legends: pevonedistat (MLN4924; MedChemExpress, HY-70062), MTX (MedChemExpress, HY-14519), lometrexol (LMX; MedChemExpress, HY-14521), brequinar (MedChemExpress, HY-108325), rapamycin (Adooq Biosciences, A10782), 5-phospho-d-ribose 1-diphosphate (PRPP; Sigma-Aldrich, P8296), l-glutamine (Sigma-Aldrich, G8540); adenosine-5′-monophosphate; (AMP; Sigma-Aldrich 01930), inosine-5′-monophosphate (IMP; MedChemExpress, HY-W010759), guanosine-5′-monophosphate (GMP; Sigma-Aldrich, G8377), AICA-ribonucleotide (Cayman Chemicals, 33907), adenine (Thermo Fisher Scientific, A17622.14), hypoxanthine (MedChemExpress, HY-N0091), 6-TG (Thermo Fisher Scientific, B21280.03), 6-MP (Adooq Biosciences, A15898), 6-thioinosine-5′-monophosphate (6-TIMP; Jena Biosciences, NU-1148), 6-methylthioinosine-5′-monophosphate (6-meTIMP; Jena Biosciences, NU-1226), 6-methylthioguanosine-5′-monophosphate (6-meTGMP; Jena Biosciences, NU-1128), 6-benzylthioinosine-5′-monophosphate (6-benzylTIMP; WuXi, custom synthesis); staurosporine (Selleckchem, AM-2282); 6-ethylthioinosine-5′-monophosphate (6-etTIMP; WuXi, custom synthesis) amd 6-ethylmercaptopurine riboside (6-EMPR; WuXi, custom synthesis). Liquid chromatography–mass spectrometry (LC–MS) and proton nuclear magnetic resonance (HNMR)/carbon nuclear magnetic resonance (CNMR) spectra for chemicals synthesized by WuXi are attached as Supplementary Fig. 3.
Immunoprecipitation
Small-scale immunoprecipitation
Cells were collected from one 10-cm plate per condition by aspirating medium, scraping and washing in cold Dulbecco’s phosphate-buffered saline (DPBS), and pellets were flash-frozen in liquid nitrogen or immediately processed. Cell pellets were lysed in in 500 μl lysis buffer (30 mM HEPES-NaOH pH 7.5, 150 mM NaCl, 5 mM MgCl2, 0.1% NP40) supplemented with EDTA-free protease inhibitors (Roche, 11873580001), PhosStop phosphatase inhibitors (Roche, 4906845001) and benzonase (Millipore, 70746). Lysis was allowed to proceed for 30 min with rotation, and lysates were clarified by centrifugation at 21,000g. An input sample was taken from the supernatant by mixing 1:1 with 2× urea sample buffer (120 mM Tris pH 6.8, 4% SDS, 4 M urea, 20% glycerol and bromophenol blue), and the remaining supernatant was incubated with Flag-M2 agarose beads (15 μl of 50% slurry per condition; Millipore, A2220) for 2 h at 4 °C with rotation. Beads were then washed three times with immunoprecipitation buffer and eluted at 65 °C with 1× urea sample buffer.
Large-scale immunoprecipitation for mass spectrometry proteomics
For immunoprecipitation–mass spectrometry (IP–MS), cells were collected from 10× 15-cm plates per condition, lysed in 5 ml lysis buffer and processed as described above for the NUDT5(3×Flag) immunoprecipitation using 90 µl Flag-M2 resin slurry per sample. For the PPAT–V5-TwinStrep and NUDT5(3×Flag) sequential immunoprecipitation, supernatant was first bound to Strep-Tactin XT 4Flow resin (IBA, 2-5010-010), washed three times in lysis buffer and eluted in lysis buffer containing 50 mM biotin (2-1016-005). Eluate was then incubated with Flag-M2 affinity resin for 2 h, followed by three washes in lysis buffer. A further three DPBS washes were performed after washes in lysis buffer to remove detergent. Control immunoprecipitation from wild-type HEK293T cells was performed in parallel for all IP–MS experiments. Flag-M2 beads were flash-frozen and further processed by the UC San Diego Proteomics Facility as described in ‘Mass-spectrometry-based proteomics’.
Western blotting and antibodies
Western blot samples were derived from the immunoprecipitation experiments described above, or samples were lysed in NP40 buffer (30 mM HEPES-NaOH, 150 mM NaCl and 0.5% NP40) supplemented with protease inhibitors and benzonase for 30 min on ice, and clarified by centrifugation at 21,000g. Western blot samples were normalized to protein concentration using Pierce 660nm Protein Assay reagent (Thermo Fisher Scientific, 22660). Next, 2× urea sample buffer was added to the samples, which were then denatured at 65 °C. SDS–PAGE and immunoblotting were performed using the indicated antibodies. Images were captured using a ProteinSimple FluorChem M device.
The following antibodies were used in this study, with specific dilutions varying depending on the experiment: anti-PPAT (rabbit, ProteinTech, 15401-1-AP), anti-NUDT5 (rabbit, ProteinTech, 27004-1-AP), anti-PYCR2 (rabbit, ProteinTech, 17146-1-AP), anti-HPRT (rabbit, ProteinTech,15059-1-AP); anti-vinculin (rabbit, CST, 4650), anti-Flag (mouse, Clone M2; Sigma, F1804), anti-DYKDDDDK tag (rabbit, CST, 14793), anti-NRF2 (rabbit, CST, D1Z9C), anti-NEDD8 (rabbit, CST, 19E3), anti-α-tubulin (mouse, DM1A, Calbiochem, CP06), anti-V5 (rabbit, CST, D3H8Q) and anti-HA (rabbit, CST, C29F4).
Protein expression and purification
PPAT
PPAT–V5-TwinStrep was lentivirally expressed in Expi293F human cells in which NUDT5 was bulk depleted using sgRNAs a described above. Protein preparations were performed from 2–6 l of culture collected at around 8 × 10⁶ cells per ml. Purification buffers were extensively vacuum degassed and sparged with nitrogen gas before being cooled on ice. All purification steps were done on ice or at 4 °C. Cell pellets were resuspended in lysis buffer (50 mM HEPES-NaOH pH 7.5, 150 mM NaCl and 1 mM DTT) supplemented with EDTA-free protease inhibitor cocktail and benzonase. Cells were lysed by brief sonication and clarified by centrifugation. The supernatant was treated with BioLock reagent (1 ml per 40 ml lysate; IBA, 2-0205-050) for 20 min then incubated with Strep-Tactin XT 4Flow resin for 90 min with gentle agitation. Resin was transferred into a gravity column and washed with 10 column volumes (CVs) of lysis buffer followed by 20 CVs of lysis buffer supplemented with 10 mM MgCl2 and 10 mM ATP heated to 37 °C before application to remove chaperone contamination, and an additional 10 CVs of cold lysis buffer. Protein was eluted in lysis buffer containing 50 mM biotin. The eluate was concentrated (Amicon, UFC9050) and buffer-exchanged using a 0.5-ml Zeba desalting column into lysis buffer without biotin (7 kDa molecular weight cut-off (MWCO); Thermo Fisher Scientific, 89882), flash-frozen in small aliquots and stored at −80 °C for future use. For protein preparations used in AlphaLisa binding assays, PPAT was further purified by size-exclusion chromatography (SEC) using a Superose 6 10/300 increase SEC column (Cytiva) equilibrated in SEC buffer (25 mM HEPES-NaOH pH 7.5, 150 mM NaCl and 1 mM DTT) using an ÄKTA pure 25 FPLC system (Cytiva).
NUDT5
His-SUMO-TEV-NUDT5 wild type and mutants were expressed in LOBSTR-BL21(DE3)-RIL cells (Vector Laboratories, NC1789768) induced with 0.5 mM isopropyl β-d-1-thiogalactopyranoside (IPTG) for around 16 h at 18 °C. Cell pellets were resuspended in lysis buffer (50 mM Tris-HCl pH 8, 500 mM NaCl and 10 mM imidazole) supplemented with EDTA-free protease inhibitor cocktail and phenylmethylsulfonyl fluoride (PMSF), benzonase and lysozyme. Cells were lysed by sonication and the supernatant was clarified by centrifugation. Supernatant was applied to a 5-ml HisTrap crude FF column (Cytiva, 17525501) with a syringe pump. The column was washed with 50 ml lysis buffer followed by 25 ml wash buffer (50 mM Tris-HCl pH 8, 500 mM NaCl and 30 mM imidazole) and eluted in 20 ml elution buffer (50 mM Tris-HCl pH 8, 200 mM NaCl and 300 mM imidazole). Eluate was incubated with TEV protease (1:50 w/w; produced in house by MacroLab, UC Berkeley) and dialysed overnight against 4 l buffer (50 mM Tris-HCl pH 8.0, 200 mM NaCl and 2 mM BME). The cleaved product was filtered over a HisTrap column and the flow-through was concentrated and applied to a HiLoad Superdex 75 preparative SEC column (Cytiva, 28989333) equilibrated in storage buffer (25 mM HEPES-NaOH pH 7.5, 150 mM NaCl and 1 mM DTT).
PPAT–NUDT5 for cryo-EM (AMP complex)
PPAT–V5-TwinStrep and 3×Flag–NUDT5(Y74F) were co-expressed lentivirally in 4 l wild-type Expi293F cell culture grown in Expi293 medium supplemented with 100 μM adenine and collected at around 8 × 10⁶ cells per ml. All purification steps were performed on ice or at 4 °C in purification buffer (50 mM HEPES-NaOH pH 7.5, 150 mM NaCl, 2 mM AMP and 1 mM DTT). The first Strep-tag immunoprecipitation step was performed as described above to purify PPAT, omitting the MgCl2 and ATP wash. Eluate from the Strep-Tactin XT resin was rebound to 1 ml of Flag-M2 agarose resin for 2 h in purification buffer without DTT, washed three times and eluted three times in a total of 6 ml purification buffer supplemented with 1 mg ml−1 3×Flag peptide (Sigma-Aldrich, F4799). The Flag-M2 eluate was concentrated in a 100-kDa-MWCO concentrator (Amicon) and applied to a Superose 6 10/300 increase SEC column (Cytiva, 29091596) equilibrated in SEC buffer (25 mM HEPES-NaOH pH 7.5, 150 mM NaCl, 2 mM AMP and 1 mM DTT). The complex was concentrated to around 9 mg ml−1 and used immediately for cryo-EM grid preparation.
PPAT–NUDT5 for cryo-EM (6-meTIMP and 6-benzylTIMP complexes)
PPAT–V5-TwinStrep and bacterially expressed NUDT5(Y74F) were purified separately as described above. In this case, we used NUDT5(Y74F) because it forms a more stable complex with PPAT than does the wild-type protein. NUDT5 (75 μM) was incubated with PPAT (15 μM) directly after elution of PPAT from Strep-Tactin resin for 1 h in 2 ml Strep-Tactin elution buffer (50 mM HEPES-NaOH pH 7.5, 150 mM NaCl, 1 mM DTT and 50 mM biotin) supplemented with 200 μM 6-meTIMP (Jena Biosciences, NU-1226) or 6-benzylTIMP (WuXi). The protein mixture was concentrated to 350 μl and the concentration of nucleotide adjusted to 1 mM. After another 1-h incubation, the complex was applied to a Superose 6 10/300 increase SEC column (Cytiva) equilibrated in SEC buffer (25 mM HEPES-NaOH pH 7.5, 150 mM NaCl, 50 μM 6-meTIMP or 200 μM 6-benzylTIMP and 1 mM DTT). Fractions containing the PPAT–NUDT5 complex were concentrated to around 15 mg ml−1. The complex was diluted to 10 mg ml−1 and a final concentration of 2 mM 6-meTIMP/6-benzylTIMP in cryo-EM buffer (25 mM HEPES-NaOH pH 7.5, 150 mM NaCl and 1 mM DTT) and used immediately for grid preparation.
Cryo-EM sample preparation, data collection and analysis
Cryo-EM samples were mixed with a final concentration of 0.02% (w/v) fluorinated octylmaltoside (Anatrace, O310F) immediately before cryo-freezing to prevent protein denaturation at the air–water interface. Then, 2.6 μl of the sample was applied to a glow-discharged 300-mesh Quantifoil R1.2/1.3 grid and incubated for 15 s before being blotted and plunge-vitrified in liquid ethane cool-protected by liquid nitrogen. Grid freezing was performed using a Mark IV Vitrobot (Thermo Fisher Scientific) system operating at 12 °C and 100% humidity.
Cryo-EM data were collected using a 300 kV Titan Krios G3i microscope (Thermo Fisher Scientific) equipped with a BIO Quantum energy filter (slit width 20 eV). Data were collected using SerialEM software at a nominal magnification of 105,000× with a pixel size of 0.424 Å per pixel. Movies were recorded using a Gatan K3 Direct Electron Detector operating in super-resolution CDS mode. Each movie was composed of 40 subframes with a total dose of 50 e− per A2, resulting in a dose rate of 1.25 e− per A2. Data processing, including motion correction, CTF estimation, particle picking, two-dimensional (2D) class averaging and three-dimensional (3D) refinement, was performed using the cryoSPARC v.4.3 workflow51, with mostly default settings. All movies were 2× binned and patch motion corrected. After particle picking and several iterations of 2D class averaging, the initial 3D volume was calculated using several rounds of ab initio 3D reconstruction. Selected particles were then used for non-uniform 3D refinement. Default B-factor sharpening or local filtering was used to generate the final sharpened maps. Reported resolution is based on the corrected masking value for the gold-standard FSC from refinements in cryoSPARC.
Model building
The AlphaFold3 PPAT–NUDT5 monomer complex prediction (Extended Data Fig. 2a,b) was performed by co-folding one protomer of NUDT5 and PPAT using AlphaFold3. The initial model for the PPAT–NUDT5 complex (Extended Data Fig. 2c,d) was generated using AlphaFold332 by specifying four chains of NUDT5 (UniProt ID: Q9UKK9), four chains of PPAT omitting the first 11 amino acids (UniProt ID: Q06203) and 8 molecules of AMP. Coordinates for 4Fe–4S clusters were added by aligning Bacillus subtilis PPAT (PDB ID: 1GPH) to the AlphaFold model. The model was fitted into the high-resolution cryo-EM density map in ChimeraX (v1.9)52, and model regions without adequate density in the unsharpened map were deleted. Models were iteratively refined using a combination of ISOLDE (v.1.2)53 in ChimeraX (v.1.9), Coot (v.0.9.4.1)54 and phenix.real_space_refine and phenix.validation_cryoem in PHENIX (v.1.21.2-5419)55. Models from the AMP-bound datasets were used as initial models for the additional datasets. The Grade2 server was used to generate ligand structure and restraints for the 6-meTIMP and 6-benzylTIMP (Global Phasing).
PPAT activity assay
PPAT activity assays monitoring glutamate formation were performed in 96-well PCR plates at a final volume of 20 μl, and all reaction components were diluted in PPAT reaction buffer (50 mM HEPES-NaOH pH 7.5, 150 mM NaCl, 5 mM MgCl2, 0.1 mg ml−1 BSA and 1 mM DTT). First, 5 µl of nucleotide dilution was added to each well, followed by 5 µl of buffer or NUDT5 (Cf = 10 µM), and then 5 μl of PPAT (Cf = 50 nM). The initial PPAT species was determined to be mostly dimeric by mass photometry, with a minor monomeric population (Extended Data Fig. 6c). Reaction components were incubated at room temperature for 30 min, then initiated by adding 5 µl of 4× substrate mixture containing PRPP (Cf = 1 mM; Sigma-Aldrich) and glutamine (Cf = 4 mM; Sigma-Aldrich). Some assays were performed with 0.25 mM PRPP to better measure competitive inhibitor potency, indicated in the figure legends. Reactions proceeded for 8 min at 37 °C in a thermocycler and were quenched at 98 °C for 2 min. Reaction kinetics were observed to be linear for 12.5 min for reactions at both 0.25 mM and 1 mM PRPP. Reactions were diluted 1:100 in 10 mM HEPES-NaOH pH 7.5, and 20 µl of dilution was transferred to a white 384-well microplate (Corning, 3752). Then, 5 μl of Glutamate-Glo reagent (Promega, J7021) was added to each well and incubated for 2 h, and luminescence signal was measured on a Perkin Elmer EnVision microplate reader.
Raw data were fitted to a four-parameter logistic equation, Y = Ymin + (Ymax − Ymin)/(1 + (X/10logKi)n) in Python (v3.11.8) using the scipy.optimize.curve_fit function and fits were manually inspected. Inhibition curves that reached saturation were baseline normalized using both Ymin and Ymax values, whereas conditions that did not reach saturation were normalized using only Ymax. Normalized data were plotted in GraphPad Prism (v.10) and fitted using the ‘[Inhibitor] versus response (four parameters)’ equation with the bottom value fixed at 0. The reported Ki is the mean ± s.e.m. from n = 3 independent experiments.
PPAT–NUDT5 binding assays
AlphaLisa assay
To measure the apparent Kd for NUDT5 wild-type and mutants, PPAT–V5-TwinStrep (125 nM) was incubated with N-terminally tagged wild-type NUDT5(6×His–HA) (125 nM) to form a tracer complex in the presence of increasing amounts (0–100 μM) of untagged wild-type or mutant NUDT5 competitor in binding buffer (25 mM HEPES-NaOH pH 7.5, 150 mM NaCl, 5 mM MgCl2, 0.01% NP40 and 0.1% BSA) supplemented with 1 mM AMP. For the measurement without supplemented AMP, tagged PPAT and NUDT5 tracer complex components were incubated at 250 nM each. After a 4-h incubation at 25 °C, binding reactions were diluted to a final concentration of 25 nM of each component, and 12.5 μl of the dilution was mixed with 12.5 μl of 2× AlphaLisa bead mixture in binding buffer containing Strep-Tactin donor beads (40 μg ml−1; Revvity, 6760002S) and anti-HA acceptor beads (20 μg ml−1; Revvity, AL170C) in a light-grey 384-well plate (Revvity, 6057350). Notably, we observed that the PPAT–NUDT5 complex did not further assemble or dissociate when diluted to assay-compatible concentrations. After a 30-min incubation at 25 °C, the AlphaLisa signal was read using a Perkin Elmer EnVision microplate reader. Bead-only and biotin elution controls were used to ensure signal specificity.
To measure metabolite-induced dissociation and stabilization of the complex, PPAT–V5-TwinStrep (3 μM) was incubated with NUDT5(6×His–HA) (3 μM) in binding buffer for 2 h at 25 °C. For NUDT5(L217A/K218A) complexes, the initial incubation was performed with 10 μM of each component. To measure PRPP-dependent dissociation, complexes were diluted to 50 nM in buffer containing AMP or 6-meTIMP and incubated for 15 min. Binding reactions were further diluted 1:1 with PRPP (Cf = 0–11 mM) in binding buffer for an additional 30 min. For assay set-ups monitoring the stabilization of PPAT–NUDT5 at a fixed concentration of PRPP, binding reactions were first diluted to 75 nM and mixed 1:1 with a concentration series of AMP (Cf = 0–16.7 mM) or 6-meTIMP (Cf = 0–0.33 mM) diluted in binding buffer. After 15 min, PRPP (Cf = 1 mM) was added, and reactions were incubated for an additional 30 min. Reactions were mixed with AlphaLisa beads and incubated, and the signal was read as described above. Raw data were fitted to a four-parameter logistic equation, Y = Ymin + (Ymax − Ymin)/(1 + (\(X/{10}^{{\mathrm{logIC}}_{\mathrm{50}}}{)}^{n}\)) in Python (v.3.11.8) using the scipy.optimize.curve_fit function and fits were manually inspected. Inhibition curves that reached saturation were baseline normalized using both Ymin and Ymax values, whereas conditions that did not reach saturation were normalized using only Ymax. Normalized data were plotted in GraphPad Prism (v.10) and fitted using the ‘[Inhibitor] versus response variable slope (four parameters)’ equation with the bottom value fixed at 0. The reported IC50 or half-maximum effective concentration (EC50) value is the mean ± s.e.m. from n = 3 independent experiments.
Mass photometry
Complexes were formed for 2 h at 25 °C in binding buffer (25 mM HEPES-NaOH pH 7.5, 150 mM NaCl, 5 mM MgCl2 and 1 mM DTT) with PPAT (1 μM) and wild-type NUDT5 (1 μM) or 3 μM of each component for complexes containing NUDT5(L217A/K218A) in the absence or presence of AMP (1 mM). For conditions with PRPP (1 mM), it was added around 1 h before sample measurement. Conditions containing only PPAT or NUDT5 were assembled at 1 μM of protein component. Binding reactions were rapidly diluted in binding buffer and immediately measured using a Refeyn Mass Photometer TwoMP within 10 s of dilution with a normal viewing window and 1-min recording time using AquireMP software (Refeyn). Data were processed using the MassFerence P1 standards for mass estimation (Refeyn, MP-CON-41033) and figures were assembled in the DiscoverMP software (Refeyn). All mass photometry measurements were repeated at least twice in independent experiments.
Mass-spectrometry-based metabolomics
Isotope tracing experiments
Cells were seeded in 6-cm dishes in DMEM with 10% dFBS and 2 mM l-glutamine. For experiments with hypoxanthine, 20 μM was included at plating. For experiments with 6-MP, 20 μM of drug was added around 36 h after plating and around 12 h before the addition of isotopes for tracing. Around 48 h after plating, the medium was exchanged by washing plates once in a minimal medium (DMEM with dFBS) before adding medium containing either [15N-amide]-l-glutamine (2 mM; Cambridge Isotope Laboratories, NLM-557) or unlabelled l-glutamine (2 mM) with fresh hypoxanthine or 6-MP (20 µM) supplemented for the described treatments. After labelling for 3 h, cellular metabolism was quenched by aspirating medium, snap-freezing plates in liquid nitrogen and storing at −80 °C until extraction. Plates were collected in parallel accounting for cell number for proactive normalization during sample processing. Intracellular metabolites were extracted by adding extraction solvent (40% acetonitrile, 40% methanol, 20% water and 0.1 M formic acid with 1 μM 13C6-glucose-6-phosphate and 10 μM 13C1-fructose-1,6-bisphosphate internal isotopic standards) to each dish (7.5 × 10⁶ cells per ml extraction solvent) and incubated at 4 °C for 10 min. Cell extracts were scraped, neutralized with ammonium bicarbonate (0.1 M final) and stored at −80 °C until analysis. Before injection, cell extracts were centrifuged at 17,000g for 10 min at 4 °C, and supernatant was used for analysis.
Metabolites from cellular extracts were injected (10 μl) and separated using the SeQuant ZIC-pHILIC column (5 mm polymeric sorbent, 150 × 2.1 mm; Millipore-Sigma, 1.50460.0001) using an Agilent 1260 Infinity HPLC. Autosampler used a 10-s needle wash between samples (1:1:1 isopropanol, acetonitrile, water) and was maintained at 10 °C. Chromatographic separation was performed using a 30-min linear gradient starting at 10% ammonium acetate (20 mM, pH 9.3) with medronic acid (5 μM; Agilent, 5191-4506) and 90% acetonitrile, and terminating at 30% acetonitrile. Flow rate and column temperature were maintained at 200 μl per min and 15 °C, respectively. A triple-quadrupole mass spectrometer (Agilent 6430 QQQ) equipped with electrospray ionization was coupled to the HPLC system to perform targeted metabolomics through dynamic multiple reaction monitoring (dMRM). The dMRM method used both positive and negative ionization mode, with metabolite m/z and retention times optimized and validated using an in-house metabolite library. QQQ source parameters were held constant at: gas, 350 °C at 11 l per min; nebulizer, 25 psi; capillary, 3,000 V (both negative and positive). Agilent MassHunter (v.10.1) was used for data acquisition, and Skyline (MacCoss Lab v.24.1.0.214)56 was used for analysis. Parameters for metabolite identification are included as Supplementary Table 1.
Each independent experiment contained three biological replicates per sample per treatment group. To quantify the relative abundance of total metabolite pools in unlabelled samples, the total peak area for all measured isotopologues was normalized to the isotopic standard with the closest retention time. For de novo purine synthesis rates in [15N-amide]-l-glutamine-labelled samples, all raw peak areas were corrected for the natural abundance of 15N, 13C, 18O and 2H isotopes using IsoCorrectoR (v.3.22)57. Isotope enrichment was calculated using the corrected peak areas of the fully labelled isotopologue relative to the sum of all biologically relevant isotopologues. For AMP and IMP, relevant isotopologues included M+0 and M+2, where M+2 was deemed fully labelled. For GMP, relevant isotopologues included M+0, M+2 and M+3, where M+3 was deemed fully labelled.
Measurements of thiopurine metabolite abundance
Intracellular levels of 6-TIMP and 6-meTIMP were determined by LC–MS/MS. Cells were washed with cold PBS before the addition of a 40/40/20 mixture of LC–MS-grade acetonitrile/methanol/water + 0.1% formic acid for intracellular metabolite extraction. Cells were incubated for 30 min at −20 °C, then centrifuged at 14,000 rpm for 10 min to pellet insoluble material. Isotope-labelled 13C-15N amino acids (Cambridge Isotope Laboratories, MSK-A2-1.2) were also spiked into each sample as internal standards to monitor analytical conditions. The supernatant was transferred to LC–MS vials for metabolomics analysis, with 2 μl of sample used for analysis.
Untargeted metabolomics was done on a Vanquish UHPLC system coupled with an Orbitrap Exploris 240 mass spectrometer (Thermo Fisher Scientific). Polar metabolites were separated on a XBridge Amide Column (2.1 mm inner diameter (ID) × 100 mm, particle size 3.5 μm; Waters,186004860) which was consistently housed at 40 °C. Mobile phases were prepared as follows: (A) 95/5 (v/v) water/acetonitrile with 10 mM ammonium hydroxide and 10 mM ammonium acetate; (B) 5/95 (v/v) water/acetonitrile with 10 mM ammonium hydroxide and 10 mM ammonium acetate. The mobile phases were delivered at a flow rate of 0.15 ml per min for a 25-min run with the following stepwise gradient for solvent B: 0 min, 85% B; 2.5 min, 70% B; 7 min, 55% B; 16 min, 35% B; 16.1–8 min, 25% B; 18–25 min, 85% B. The electrospray ionization source (ESI) was operated in positive mode. The ion spray voltage was set at 4 kV, with the ion transfer tube temperature set at 350 °C, vaporizer temperature 325 °C, sheath gas 35 arbitrary units (a.u.), aux gas 5 a.u. and sweep gas 1 a.u. Full MS scans of 1 ms were performed at a resolution of 90,000 units, with a scan range of 60–900 m/z. A pooled quality control (pQC) sample followed by a blank (mobile phase solution) injection was performed among every ten injections of biological samples to monitor instrument performance. The pQC samples were also used for the top ten MS/MS analyses with dynamic exclusion during the analysis for compound identification. Peaks were integrated using the Quan Browser module within Xcalibur and were normalized to protein content for each sample.
Mass-spectrometry-based proteomics
Sample processing
Flag-M2 beads from immunoprecipitations were diluted in TNE (50 mM Tris pH 8.0, 100 mM NaCl and 1 mM EDTA) buffer. RapiGest SF reagent (Waters, 186008090) was added to the mix to a final concentration of 0.1%, and the samples were boiled for 5 min. TCEP was added to 1 mM (final concentration) and the samples were incubated at 37 °C for 30 min. Subsequently, the samples were carboxymethylated with 0.5 mg ml−1 iodoacetamide for 30 min at 37 °C followed by neutralization with 2 mM TCEP (final concentration). The protein samples were then digested with trypsin (trypsin:protein ratio, 1:50) overnight at 37 °C. RapiGest was degraded and removed by treating the samples with 250 mM HCl at 37 °C for 1 h followed by centrifugation at 14,000 rpm for 30 min at 4 °C. The soluble fraction was then added to a new tube and the peptides were extracted and desalted using C18 desalting columns (Thermo Fisher Scientific, PI-87782). Peptides were quantified using the BCA assay and a total of 1 μg of peptides were injected for LC–MS analysis.
LC–MS analysis
Trypsin-digested peptides were analysed by ultra-high-pressure liquid chromatography (UPLC) coupled with MS/MS using nanospray ionization. The nanospray ionization experiments were performed using a TimsTOF 2 pro hybrid mass spectrometer (Bruker) interfaced with nanoscale reversed-phase UPLC (Evosep One). The Evosep method of 30 samples per day was performed using a 10 cm × 150-μm reversed-phase column packed with 1.5-μm C18-beads (PepSep, Bruker) at 58 °C. The analytical columns were connected with a fused silica emitter (10 μm ID; Bruker Daltonics) inside a nanoelectrospray ion source (captive spray source; Bruker). The mobile phases comprised 0.1% formic acid as solution A and 0.1% formic acid/99.9% acetonitrile as solution B. Data-independent acquisition with parallel accumulation-serial fragmentation (dia-PASEF) MS settings were used for data collection on a TimsTOF Pro 2, with the outlined parameters as follows: the values for mobility-dependent collision energy were set to 10 eV; no merging of TIMS scans was performed; the ion mobility (IM) was set between 0.85 (1/k0) and 1.3 (1/k0) with a ramp time of 100 ms; each method includes one IM window per dia-PASEF scan with a variable isolation window at 20 AMU segments; 34 PASEF MS/MS scans were triggered per cycle (1.38 s) with a maximum of 7 precursors per mobilogram; and precursor ions in an m/z range between 100 and 1,700 with charge states ≥3+ and ≤8+ were selected for fragmentation. Protein identification, label-free quantification, post-translational modification (PTM) quantification and statistical analysis were performed using default settings in Spectronaut 18.0 (Biognosys). The peptide search allowed for two missed cleavages and included phosphorylation (STY) as a variable modification in addition to acetylation and oxidation. Data were mapped to the UniProt reference proteome UP000005640.
For the PPAT–V5-TwinStrep–NUDT5–3×Flag sequential immunoprecipitation and NUDT5–3×Flag immunoprecipitation comparison, DIA protein quantity for candidate hits from both experiments was normalized to that measured for the NUDT5 bait. The resulting gene list was compared to the CRAPome database of common mass spectrometry contaminants, and hits that were found in more than 50% of database experiments were removed from the analysis.
Multiple sequence alignment
Multiple sequence alignment (MSA) was performed using Clustal Omega58. The UniProt sequence identifiers are as follows (species, NUDT5 accession, PPAT accession): human (Homo sapiens, Q9UKK9, Q06203); primate (Macaca mulatta, A0A1D5QNV6, F7GPV9); mouse (Mus musculus, Q9JKX6, Q8CIH9); rat (Rattus norvegicus, Q6AY63, P35433); chicken (Gallus gallus, A0A8V0XJK7, P28173); frog (Xenopus laevis, Q6IND3, A0A974DTF4); fish (Danio rerio, Q6IQ66, A6H8S4).
Software and programs
All software used is freely or commercially available: FACSDiva (v.9.0), FlowJo (v.10.10.0), GraphPad Prism (v.10), SerialEM (v.4.1), AlphaFold 3, Coot (v.0.9.8.92), ChimeraX (v.1.8), PyMOL (v.2.5.5), PHENIX (v.1.21.1-5286), cryoSPARC (v.4.3), Isolde (v.1.2), Spectronaut (v.18.0), Agilent MassHunter (v.10.1), Skyline (MacCoss Lab v.24.1.0.214), Xcalibur (v.4.3). Python (v3.10), SciPy library (v.1.11), Matplotlib (v.3.7), IsoCorrectoR (v.3.22), Refeyn AquireMP (2024 R2) and Refeyn DiscoverMP (2024 R2).
Reporting summary
Further information on research design is available in the Nature Portfolio Reporting Summary linked to this article.

