


Ethics statement
Human CB samples were obtained with informed consent from Trillium Health, Credit Valley and William Osler Hospitals according to procedures approved by the University Health Network (UHN) Research Ethics Board (REB# 02-0763). The investigation of data from the Ontario Health Study was approved by the University of Toronto Research Ethics Board (protocol #00033112). Consent for use of data and blood samples was previously collected through the Ontario Health Study63 and CARTaGENE64 regional cohorts within the Canadian Partnership for Tomorrow’s Health65. All research using human material was performed in accordance with relevant guidelines and regulations.
Human CB sample processing
Mononuclear cells from pools of male and female CB (approximately 1–8 donors) were obtained by centrifugation over a density barrier of Lymphoprep (Multicell). After red cell lysis with ammonium chloride (STEMCELL technologies), mononuclear cells were enriched for HSPCs by positive selection with a CD34 Microbead kit (Miltenyi) per the manufacturer’s instructions, or by lineage depletion as previously described66. Resulting HSPC-enriched CB cells were cryopreserved in 50% PBS, 40% fetal bovine serum (FBS) and 10% DMSO and stored at −80 °C short term or −150 °C long term.
CB LT-HSC scRNA-seq
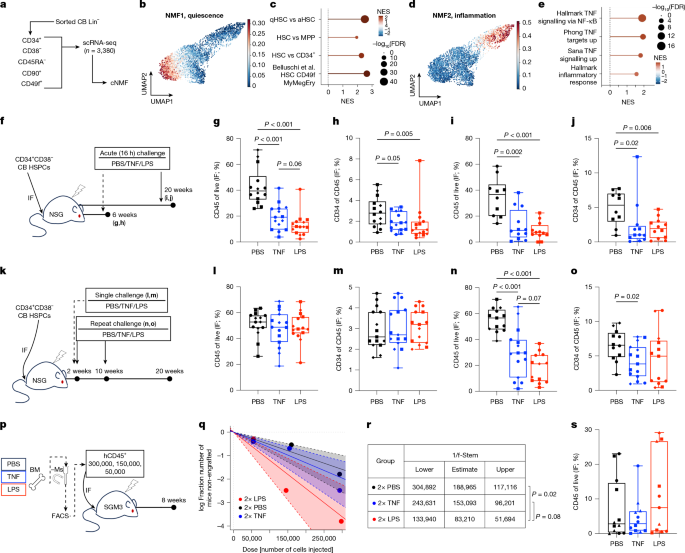
Human immunophenotypic LT-HSCs were purified from pooled CB samples based on a Lin–CD34+CD38−CD45RA−CD90+CD49f+ immunophenotype (see FACS section below). CB LT-HSCs were purified and submitted to the Hospital for Sick Children Genomics Core for scRNA-seq profiling on the BD Rhapsody platform.
Mice
Animal experiments were done in accordance with institutional guidelines approved by the UHN Animal Care Committee. The following mouse strains (The Jackson Laboratory) were used in this study: NOD.Cg-Prkdcscid Il2rgtm1Wjl/SzJ (NSG; strain 005557), NSG-Tg(CMV-IL3,CSF2,KITLG)1Eav/MloySzJ (NSG-SGM3; strain 013062) and NSG-Kitem1Mvw/SzJ (NSGW41). All in vivo experiments were done with 8–12-week-old female or male mice. NSG and NSG-SGM3 were conditioned with 225 cGy of gamma radiation; NSGW41 females were not irradiated. All mice were housed at the animal facility (ARC) at Princess Margaret Cancer Centre in a room designated only for immunocompromised mice with individually ventilated racks equipped with complete sterile microisolator caging (IVC), on corncob bedding and supplied with environmental enrichment in the form of a red house or tube and a cotton nestlet. Rooms were maintained at 21–22 °C and 30–40% humidity with a 12 h–12 h light–dark cycle with sunset and sunrise. Cages were changed at least once a week under a biological safety cabinet. Health status was monitored using a combination of environmental monitoring and evaluation of soiled bedding from sentinel mice.
FACS and flow cytometry analyses
HSPC-enriched human CB cells were thawed via slow dropwise addition of X-VIVO 10 media (Lonza) with 50% FBS and 100 μg ml–1 DNaseI (Roche). Cells were centrifuged at 400g for 10 min, then resuspended in PBS + 5% FBS. The populations sorted for individual experiments are indicated; populations are designated based on the full stem and progenitor hierarchy as previously described37,67. Cells were resuspended at less than 107 cells per millilitre and stained in one or two subsequent rounds for 15 min at room temperature each. See Supplementary Table 22 for antibodies. Cells were washed following staining and resuspended in PBS + 2% FBS and filtered through a 35-μm nylon mesh for sorting or analyses. To isolate xenografted human cells, bone marrow from three to five mice per experimental group was thawed, pooled, mouse depleted using a MACS-based kit (Miltenyi) and stained for cell sorting. Cells were isolated with BD FACSAria Fusion, BD FACSAria III or BD Symphony S6 cell sorters, or analysed on BD FACSCelesta or BD Symphony A1 coupled to a high-throughput system; instruments were controlled using BD FACSDiva software (v9). Flow cytometry data were evaluated using FlowJo (v10.8–10.10).
CB xenotransplantation
Following cell sorting, 8,000–10,000 CD34+CD38− cells were transplanted by intrafemoral injection into the right femur of appropriately conditioned age-matched and sex-matched mice in a volume of 30 μl PBS. The number of recipients was selected to minimize animal usage (n = 3–5 per group) while ensuring statistical comparisons can be made, and cohorts reproduced with independent CB pools to account for donor variability. Mice were randomized. To induce acute inflammatory stress, mice were injected intraperitoneally with 5 μg TNF or 40 μg LPS at the indicated time points. Control groups were injected with the vehicle control PBS. Mice were randomly assigned to experimental groups. Mice were euthanized at the indicated time points by cervical dislocation and the injected femur along with other hindlimb long bones (non-injected femur and both tibias) collected into Iscove’s modified Dulbecco’s medium + 5% FBS. Spleens were also collected in the same medium. Mice were numbered, and technical work was subsequently carried out without knowledge of experimental grouping. For some experiments, blood was collected from the saphenous vein of mice into K2EDTA tubes (BD) immediately before euthanasia. Injected and non-injected bones were flushed separately in Iscove’s modified Dulbecco’s medium + 5% FBS using a 23-G needle for some experiments. Alternatively, bones from most mice euthanized at a 20-week post-transplant time point were crushed in PBS + 5% FBS using a mortar and pestle and the resulting cell suspension passed through a 40–70-μm nylon mesh. Spleens were macerated using a syringe plunger, then passed through a 35-μm nylon mesh. Typically, 5–10% of cells were analysed for human chimerism and lineage markers using flow cytometry; antibodies are listed in Supplementary Table 22. Remaining cells were cryopreserved. Plasma was separated from blood and cryopreserved. For serial transplantation, xenografted cells were sorted for human CD45 (Supplementary Table 22) and transplanted into NSG-SGM3 mice at the indicated cell doses. A mouse was considered engrafted if human chimerism was more than 0.05% and LT-HSC frequency by limiting dilution assay was estimated using the ELDA software68 (http://bioinf.wehi.edu.au/software/elda/).
T cell culture and CapTCRseq
Approximately 300,000 CD45+CD34−CD19−CD33− were isolated by FACS as described above from cryopreserved xenograft bone marrow to enrich T cells and deplete B, myeloid and progenitor cells. Cells were seeded in X-VIVO 20 media supplemented with 5% human AB serum and 30 U ml–1 hIL-2 and stimulated with anti-CD3/CD28 Dynabeads (0.5 beads per cell)69. Live cells were counted by trypan blue exclusion on a haemocytometer and maintained in culture for 8 days before harvesting. Genomic DNA was extracted with a QIAamp DNA blood mini kit (Qiagen), quantified using a NanoDrop ONE instrument and submitted for CapTCRseq70 at the Princess Margaret Genomics Centre. Shannon’s diversity index was calculated for the reads obtained for the three TCR genes as previously described71.
Cytokine array
Cryopreserved plasma was submitted for a multiplex human/mouse cytokine assay (HUMU41) to EVE technologies.
scMultiome and scRNA-seq library preparation
CB was thawed and stained for FACS and sorted for CD19−CD34+CD38− and CD19−CD34+CD38+ populations. The two populations were pooled back together at known ratios for further processing for scMultiome. Cryopreserved bone marrow from xenografted mice was processed for FACS and sorted for CD19−CD34+CD38−CD45RA− HSPCs for scMultiome and CD19−CD34−CD33+ myeloid cells or CD19−CD34+CD38+ progenitor cells for scRNA-seq. scMultiome processing, including nuclei isolation and library construction, was performed by the Princess Margaret Genome Centre for downstream 10X Genomics scMultiome RNA + ATAC sequencing using their standard or low-input protocol, as appropriate. Specifically, for generation of the xenograft datasets described in Figs. 2a and 5d, we utilized three CB pools derived from a total of 62 individual donors, with approximately equal representation of male and female donors. The three biologically independent pools, each with three treatment conditions, namely, PBS, TNF or LPS, were sorted separately. Ultimately, cells profiled were derived from a total of 13 mice for the PBS and LPS groups, and 15 mice for the TNF group. The HSPCs from each treatment group were pooled after sorting for downstream processing. The CD34+CD38+ progenitors and CD33+ myeloid cells were cryopreserved as separate biological samples and subsequently thawed, and viable cells were pooled into PBS, TNF or LPS. The 10X Genomics 3′ scRNA-seq library preparation and sequencing were performed by the Princess Margaret Genome Centre using their standard protocol.
CB LT-HSC scRNA-seq QC and preprocessing
Raw sequencing data were aligned using the BD SevenBridges pipeline, with default parameters. CB LT-HSCs were demultiplexed from other samples in the same run based on sample-specific barcodes. Cells passing the following criteria were used for downstream analysis: unique feature counts of more than 500, total number of molecules detected within a cell of more than 1,000, percent mitochondrial genes of less than 5%. Raw counts were normalized using scran (v1.20.1)72, followed by variable gene selection, scaling, principal component analysis (PCA) and neighbour graph construction with ten PCA components and k-nearest neighbours equal to ten. The neighbour graph was used to construct a force-directed graph for visualization using v1.8.2 Scanpy73.
Consensus NMF
Consensus non-negative matrix factorization (cNMF; cnmf v1.3.4)74 was run with 100 iterations on the single cells from components 2 to 15 to derive transcriptional gene programs of variation in an unsupervised manner. Raw counts were fed into the –counts flag, and SCTransform (v2)75 corrected counts specifically from the data slot of the SCT assay were fed into the –tpm flag of the cNMF command line function with ten workers. After running cNMF across various components, the optimal number of components was selected by assessing the silhouette score (stability) and Frobenius reconstruction error (error), as implemented in cNMF. The transcriptomic signatures were characterized using an overrepresentation analysis with the function, ‘fora’ from the package fgsea (v1.18.0)76 on the top 100 genes from each signature with HSC gene sets and additional pathways from MSigDb.
CB cNMF program
The gene expression programs of quiescence and inflammation were derived from the CB Multiome and CB LT-HSCs Rhapsody scRNA-seq datasets. These programs were characterized using overrepresentation analysis with hallmark and HSC gene sets (see ‘Data availability’ statement). To closely evaluate the relevance of the inflammation and quiescence programs identified by cNMF within the rhapsody LT-HSC and CB HSPC Multiome datasets, consensus meta-programs were defined by calculating the geometric mean of the feature weights between corresponding programs from each dataset. The genes were ranked by the combined feature weights and the top 200 were used for downstream analysis.
For further validation of meta-programs, additional CB scRNA-seq data from Lehnertz et al.77 and Zheng et al.78 were used. Specifically, scRNA-seq data from Zheng et al.78 were downloaded from GSE97104 and the published pre-processed dataset was used for downstream analysis. Moreover, raw count scRNA-seq data from Lehnertz et al.77 were downloaded from GSE153370. Doublets were filtered out using scDblFinder (v1.6.0) and further RNA filtering was performed. Cells passing the following criteria were used for downstream analysis: percentage of mitochondrial genes less than 7% and number of unique RNA transcripts detected of less than 5,000. Single-cell transcriptomes from both datasets were projected onto BoneMarrowMap32 with default parameters and HSCs were retained for downstream analysis. The enrichment for each inflammation and quiescence meta-program (based on the top 200 genes) were scored by AUCell.
scMultiome (RNA and ATAC) preprocessing
Chromium single-cell Multiome ATAC + gene expression sequencing data (scMultiome) was pre-processed with CellRanger-ARC (v2.0.0) and aligned to GRCh38. The RNA feature count matrix for each sample was corrected for ambient RNA contamination using SoupX (v1.6.2)79 with default parameters. SoupX-corrected RNA counts were processed using Seurat (v4.3.0)80 and ATAC peak counts were processed using Signac (v1.6.0)81. RNA and ATAC quality control filtering utilized the following metrics: percentage of mitochondrial genes (pct_mito), nucleosome banding pattern (nucleosome_signal), ATAC transcriptional start site enrichment (TSS_enrichment), number of unique RNA transcripts detected (nFeature_SoupX) and number of fragments in peaks (nCount_ATAC). Thresholds for quality control filtering were adapted to each dataset based on the distribution of quality control metrics. For the CB xenograft scMultiome samples, filtering thresholds were set at: nFeature_SoupX > 1,000, pct_mito < 18%, nCount_ATAC > 1,000, nucleosome_signal < 2 and TSS_enrichment > 1. For the primary CB scMultiome samples, filtering thresholds were set at: nFeature_SoupX > 300, pct_mito < 8%, nCount_ATAC > 1,000, nucleosome_signal < 2 and TSS_enrichment > 1. For the ageing scMultiome samples, filtering thresholds for RNA-seq were set unique to each sample: BM_24M (nFeature_SoupX > 300 and pct_mito < 10%), BM_26F (nFeature_SoupX > 200 and pct_mito < 15%), BM_57M_58F (nFeature_SoupX > 100 and pct_mito < 18%), BM_70F (nFeature_SoupX > 200 and pct_mito < 12%) and BM_77F (nFeature_SoupX > 200 and pct_mito < 14%). For the ageing scMultiome samples, ATAC-seq filtering thresholds were uniform for each sample: nCount_ATAC > 1,000, nucleosome_signal < 2 and TSS_enrichment > 1.
Furthermore, pooled scMultiome samples with multiple donors (CB pools A and B, bone marrow middle-aged donors and CB xenograft) were separated using SoupOrCell82 through genotype-based clustering of sequencing reads from scRNA-seq profiles. The optimal number of genotypic clusters was selected using an elbow plot of the total log probability or manually selected when the number of donors was known.
Donor sex classification
Pools of CB donors were engrafted into NSG mice from which CB xenograft samples were derived. Furthermore, some libraries of primary CB and bone marrow samples consisted of a pool of one male sample and one female sample. To account for variation from donor sex in CB xenograft samples and to demultiplex pools of primary CB and bone marrow samples, we developed an approach to cluster single cells by donor sex.
High-confidence sex classifications were first assigned by ATAC and RNA. For ATAC: among cells with an ATAC read depth of more than 6,000, those with one or more Y chromosome reads were classified as male, and those without were classified as female. For RNA: cells were scored for male-specific (on Y chromosome, excluding the pseudo-autosomal region) genes and female-specific (XIST and TSIX) genes using AddModuleScore from Seurat (v4.3.0)80. These scores were minimum–maximum normalized between 0 and 1, and adaptive thresholding was applied using a function adapted from the AUCell (v1.14.0)83 package. Cells surpassing this enrichment threshold for the male-specific gene set with zero female-specific gene expression were classified as male, and those surpassing this enrichment threshold for the female-specific gene set enrichment with zero male-specific gene expression were classified as female. Cells confidently classified as male or female by both RNA and ATAC were used, and differential expression was performed between these male and female cells to identify donor-specific genes within each dataset. Dimensionality reduction and unsupervised clustering were subsequently performed based on these donor-specific genes to cluster cells into male and female donors, and to identify clusters of doublets expressing both male and female genes. This approach was validated on artificially mixed snRNA-seq data from male and female HSPC from CB and bone marrow samples, and applied to multiplexed scMultiome samples from CB xenograft, primary CB and primary bone marrow.
Doublet identification
Within multiplexed samples, doublet cells with mixed donor genotypes were identified by SoupOrCell82. Simultaneously, snRNA-seq-based doublet identification was performed using scDblFinder (v1.6.0)84 with default parameters. We confirmed that transcriptomes with co-expression of male-specific and female-specific genes were captured as doublets by SoupOrCell as well as scDblFinder. All identified doublets were removed from downstream analysis.
CB xenograft processing and classification
After initial quality control, single-cell transcriptomes from the CB xenograft experiment were normalized by scran (v1.20.1), followed by variable feature selection, scaling and PCA reduction. Batch correction with Harmony (v0.1.1)85 was performed based on inferred donor sex. Initial dimensionality reduction and clustering revealed two outlier clusters each representing less than 1% of all cells, appearing to be contaminating T cells and pro-B cells. These clusters were excluded, and these data were re-processed, using the top 20 Harmony-corrected principal components, which were used to construct a neighbourhood graph using the top 30 nearest neighbours for each cell. UMAP reduction was performed with min.dist = 0.2 and spread = 1.
For chromatin analyses, peaks were called using MACS2 (v2.2.7.1)86 from fragment files corresponding to high-quality cells after quality control filtering. Peaks were called independently from HSPCs in each treatment condition (PBS + recovery, TNF + recovery and LPS + recovery), following the Signac pipeline. Peaks within non-standard chromosomes, genomic blacklisted regions, and those spanning less than 20 bp or more than 10,000 bp were removed from downstream analyses. From the resulting peak matrix, dimensionality reduction with latent semantic indexing (LSI) was performed following the Signac pipeline and LSI components were batch corrected by donor sex using Harmony. Harmony-corrected LSI components 2:30 were used to construct a neighbourhood graph using the top 30 neighbours for each cell. UMAP reduction was performed with min.dist = 0.2 and spread = 1.
For integrative analysis, WNN integration49 was performed using Harmony-corrected RNA PCA components 1:20 and Harmony-corrected ATAC LSI components 2:30, considering the top 30 neighbours for each cell. UMAP reduction was performed with a min.dist = 0.2 along the WNN neighbourhood graph.
CB xenograft cell-state annotations
For cell-state annotations, transcriptomes were projected onto BoneMarrowMap32 (https://github.com/andygxzeng/BoneMarrowMap) and filtered at a mapping error threshold of 2 MADs (median absolute deviations) above the median. These cell-state assignments were used to guide clustering from the WNN graph: Leiden clustering was performed at varying resolutions from 0.1 up to 10. Specific Leiden clusters from resolutions of 1, 5 or 10 were selected based on high concordance with cell-state assignments from BoneMarrowMap, and a combination of these clusters was used for cell-state annotation. For a subset of cells (approximately 1%) that were not captured by these clusters, annotation was performed based on the most frequent cell-state annotation of their nearest neighbours.
Integrated UMAP embeddings by treatment condition
For embeddings generated within each condition, WNN integration was run using the top 30 neighbours from Harmony-corrected RNA PCA components 1:20 and Harmony-corrected ATAC LSI components 2:20. UMAP reduction was performed from neighbourhood graphs for RNA only, ATAC only and integrated WNN with min.dist = 0.2 and spread = 1.2. This was repeated for each individual condition: PBS + recovery, TNF + recovery and LPS + recovery.
OCAT embedding by CB treatment condition
The conditions PBS, TNF and LPS were each treated as a separate batch. The three batches of scRNA-seq data commonly share 36,601 genes, each with 10,097 cells, 8,069 cells and 8,100 cells, respectively. No genes or cells were filtered in this analysis. OCAT87 was used to integrate these three batches of scRNA-seq datasets. OCAT pre-processed the raw gene expression matrices through log transformation and log2 normalization and performed dimension reduction on the original data to a d = 100 subspace. OCAT then selected 100 ‘ghost’ cells, centres of small cell neighbourhood in the reduced subspace, and connected each individual cells to the global ghost cell set (m = 100 × 3) through a bipartite graph. OCAT further made these edge weights sparse by allowing at most 30% of them to be non-zero. These sparse edge weights are treated as the OCAT representation of each cell and were used for downstream visualization with UMAP.
TooManyCells embedding by CB treatment condition
For analysis with TooManyCells (v2.2.0)88, single-cell transcriptomes were filtered to remove cells with less than 250 counts and only include genes present in at least 1 cell to discard low-quality reads. The filtered samples were normalized with term frequency-inverse document frequency and clustered with the TooManyCells divisive hierarchical clustering using matrix-free spectral clustering. The resulting cluster trees were pruned to a minimum of 30 cells for each leaf node to reduce the overall size of the tree and focus visualization on larger sub-populations of cells. Once pruned, the trees were labelled with cell-type annotations, highlighting the clustered differences between HSC and HSC-II populations, including additional annotation for MPP–MyLy (associated with the HSC population) and MPP-II (associated with the HSC-II population).
TooManyPeaks embedding by CB treatment condition
For analysis with TooManyPeaks89, chromatin peak matrices derived from scATAC-seq were filtered to remove cells with less than 1,000 peaks. The filtered samples were processed with latent semantic analysis for dimensionality reduction with 50 components. The peaks for scATAC-seq were not normalized. The filtered samples were clustered with TooManyPeaks, the sister method to TooManyCells. The resulting clustered trees were pruned to a minimum of 200 cells, as scATAC-seq data usually produce an exceptionally large number of clusters (leaf nodes). Once pruned, the trees were labelled in the same manner as the scRNA-seq data analysed with TooManyCells.
Transcriptional programs from xenograft scMultiome
To find reliable transcriptional markers for each cell state, a composite score was derived from four distinct differential expression statistics. At the single-cell level, the ‘wilcoxauc’ function from presto (v1.0.0)90 was applied to obtain the following statistics: (1) log2-transformed fold change (log2FC) from single cells in a group versus single cells from all other groups; and (2) AUROC metric for distinguishing between cells in a group versus cells from all other groups. Next, pseudobulk profiles were created by combining cells based on cell type, donor sex and treatment condition (excluded pseudobulks with less than five cells), and DESeq2 (ref. 91) was used to compare pseudobulks from each cell state against those from all other cell states through a likelihood ratio test. On the basis of this pseudobulk analysis, the following statistics were also incorporated: (3) test statistic from DESeq2; and (4) log2FC from DESeq2. The geometric mean from all four statistics was used to prioritize marker genes for each cell state and subsequently called ‘MarkerScore’.
This metric was also used to identify top markers between HSC-I and HSC-II, although the pseudobulk DESeq2 analysis was performed directly contrasting HSC-I and HSC-II, and accounting for treatment (PBS, TNF and LPS) as a covariate. The top 200 genes for each population were used as a program for scoring in external datasets.
Chromatin accessibility in xenograft scMultiome
For differential chromatin accessibility, pseudobulk profiles were created by combining scATAC-seq cells based on cell type, donor sex and treatment condition, and DESeq2 (ref. 91) was used to compare pseudobulks from each cell state against those from all other cell states through a likelihood ratio test, while adjusting for treatment (PBS, TNF and LPS) as a covariate. Significantly differentially enriched peaks were used as signatures for scoring enrichment in external datasets. Among differentially enriched peak sets, transcription factor motif enrichment was determined through the ‘FindMotifs’ function in Signac (v1.6.0)
GSEA
Gene set scoring was done with AUCell (RNA) and chromVAR (ATAC), as described below. GSEA was performed using the function fgseaMultilevel from fgsea (v1.18.0), with the following parameters: nPermSimple = 1,000,000, eps = 0, minSize = 15 and maxSize = 500. The test statistic from DESeq2 (ref. 91) was used as the rank statistic for each gene. For complete biological pathway analysis, GSEA was performed using the April 2023 version of ‘Human_GOBP_AllPathways_no_GO_iea’ from Gary Bader’s laboratory in Toronto (https://download.baderlab.org/EM_Genesets/current_release/Human/symbol/). EnrichmentMap92 was used for visualization of biological pathway GSEA results, only retaining signatures and pathways enriched in a given cell type at FDR < 0.01.
For benchmarking of GSEA enrichment results, external gene sets were obtained from the GOBP collection described above as well as the chemical and genetic perturbations (CGP) collection from MSigDB (https://www.gsea-msigdb.org/gsea/msigdb/collections.jsp). After filtering for gene sets with a minimum size of 15 genes and a maximum size of 500 genes, 6,653 gene sets were retained from the GOBP and 2,615 gene sets were retained from the CGP, leading to a total of 9,270 external gene sets. Given that the differential expression rank lists differ in size by comparison, we further filtered for gene sets that had at least three genes in all of the following rank lists: older-aged or middle-aged HSC versus younger-aged HSC, ICU-COVID HSC versus control HSC, ICU-COVID monocyte versus control monocyte, DNMT3A-mutant CH HSC versus control HSC, DNMT3A WT CH HSC versus control HSC, TET2-mutant CH HSC versus control HSC, and TET2WT CH HSC versus control HSC. This resulted in 8,312 external gene sets, which constituted a universal benchmark for GSEA results from each of these differential expression comparisons. Next, GSEA was rerun on HSC-iM and HSC-I programs together with all 8,312 external gene sets, and multiple testing correction was applied together on the full set of 8,314 gene sets (that is, including the HSC-iM and HSC-I programs). Gene sets were subsequently ranked by significance statistics.
Augur
Augur (v1.0.3)93 was used to determine separability of single cells between HSC-I and HSC-II pertaining to gene expression and chromatin accessibility profiles, applied independently to each treatment condition (PBS, TNF and LPS). For gene expression, Augur was applied on the normalized expression of 2,000 highly variable genes, with default parameters, whereas, for chromatin accessibility, Augur was applied to 50 LSI components, with default parameters. For ATAC, these reduced dimension components were used rather than raw chromatin peak counts due to high sparsity and number of features for the latter. The distribution of Augur classifier performance for each cross-validation split was used to represent the separability between HSC-I and HSC-II within each treatment condition.
RNA and ATAC signature scoring
Gene set scoring of previously published gene expression signatures was performed using AUCell (v1.14.0)83. Enrichment of chromatin regions in scATAC-seq data was evaluated through chromVAR (v1.14.0)94. When necessary, hg19 coordinates for chromatin signatures were converted to hg38 using package rtracklayer (v1.52.1)95 with the UCSC hg19tohg38 chain file. For both AUCell-based (RNA) and chromVAR-based (ATAC) enrichment scores, standardization was performed across cells before plotting for ease of visualization.
SCENIC+ eRegulon inference
To infer transcription factor activity from RNA and ATAC profiles by SCENIC+ (v0.1)39 within the CB xenograft scMultiome data, the 27,492 single cells from the xenograft scMultiome were first aggregated to the metacell level using the divide and conquer algorithm from the metacell2 (ref. 96) package. The highly variable genes used to construct the UMAP were used as input into the algorithm guiding feature gene selection, thus optimizing clustering for metacell partitioning. The approach generated 1,476 metacells with a target metacell size of 75,000 unique molecular identifier. Next, pycisTopic (v1.0.2) was used to identify cell states and cis-regulatory topics from the ATAC single cells in an unsupervised manner. The ideal number of topics were evaluated as per the previously reported guidelines97. Consequently, pycisTopic optimized at 18 topics. Motif enrichment analysis was subsequently carried out by leveraging pycisTarget (v1.0.2), which utilizes precomputed databases comprising motif scores and rankings for genomic regions, and a motif-to-transcription factor annotation database from the Aerts laboratory resources (https://resources.aertslab.org/cistarget/databases/homo_sapiens/hg38/screen/mc_v10_clust/region_based/). This analysis was conducted on the topics from pycisTopic and differentially accessible regions between each defined cell type.
Following pycisTopic and pycisTarget, a SCENIC+ object was created for downstream steps to create enhancer-driven GRNs using the ATAC and RNA. First, regions and genes absent in more than 0.5% of cells were filtered out. Next, cistromes were generated using the function merge_cistromes, which overlaps targets assigned to a transcription factor from the motif enrichment dictionaries with the regions in the object. Then, enhancer-to-gene relationships were inferred by first defining the search space around each gene of 150 kb upstream or downstream, specifically on the metacells, to limit RAM usage while querying ENSEMBL BioMart (host 98). After, enhancer-to-gene models were generated using gradient-boosting machines with the function calculate_regions_to_genes_relationships. Next, transcription factor-to-gene relationships were inferred using pySCENIC on the RNA metacells as per previously published guidelines83 with a candidate list of transcription factors98 and loaded into the SCENIC+ object from a saved adjacencies matrix using the function load_TF2G_adj_from_file. Finally, enhancer-driven GRNs were generated using a GSEA recovery approach from SCENIC+ using the function build_grn. The recovered eRegulons were filtered using the function apply_std_filtering_to_eRegulons, restricting analysis to high-confidence transcription factors.
Given that a gene expression-based eRegulon and a chromatin accessibility-based eRegulon were reported for each transcription factor, we performed quality control by Pearson correlation and excluded transcription factors in which correlation between gene expression-based eRegulon activity and chromatin accessibility-based eRegulon activity was below R = 0.25. This led to 133 transcription factors in which eRegulon activity passed the correlation threshold and exhibited concordance between RNA and ATAC.
Differential signature enrichment
Differential enrichment of gene or chromatin signature scores was performed by constructing linear mixed models for each signature using the cell class as an independent variable and accounting for donor sex as a random effect within the data using the function ‘dream’ from package variancePartition (v1.22.0)99. The raw and FDR-corrected P values from this analysis were used to represent significance. Simultaneously, the AUROC metric from the wilcoxauc function of the presto package (v1.0.0) was used to represent the ability of a signature enrichment score to accurately discern between contrasting cell classes.
Applied to SCENIC eRegulons in which two enrichment scores are used for each transcription factor, representing activity by gene expression as well as chromatin accessibility, these two results were integrated to identify top marker transcription factors for a given cell type or condition. Here the mean AUROC metric and the mean −log10(FDR) value were used together to identify top marker transcription factors across RNA and ATAC modalities.
SCENIC+ transcription factor network construction
Among transcription factors with significant eRegulon activity enrichment in a specific cell state or condition at FDR < 0.05 by both RNA and ATAC modalities, GRNs were constructed. In brief, the strength of transcription factor regulation for a target gene was represented through two metrics: (1) importance of the RNA-based transcription factor-to-gene association, and (2) the importance of the ATAC-based chromatin region-to-gene association among nearby chromatin regions containing the transcription factor motif. The geometric mean of these two metrics was taken to represent the overall strength of regulation of target gene expression by a transcription factor. Finally, this score was subject to adaptive thresholding in line from the AUCell package as described above, and transcription factor-to-transcription factor regulation surpassing this adaptive threshold was retained to construct a transcription factor regulatory network from each condition.
Analyses of external bulk RNA-seq datasets
For differential expression analysis in bulk RNA-seq datasets, DESeq2 (v1.32.0)91 was applied to raw count data. For sample-level scoring of gene set enrichment, GSVA (v1.40.1)100 scoring was performed on normalized gene expression data with the ‘kcdf’ parameter set to ‘Gaussian’. Normalized data from the original studies were used when available, otherwise raw count data were subject to vst normalization through DESeq2. For mouse bulk RNA-seq data, mouse genes were converted to human orthologues using babelgene (v22.3) and only conversions supported by a minimum of five databases were retained. These converted gene names were used for downstream processing as described.
For differential accessibility in bulk ATAC-seq datasets, peak count matrices were obtained from the original studies, and differentially accessible peaks were identified through DESeq2. Scoring of chromatin signatures was performed through chromVAR. When comparing gene signature and chromatin signature enrichment between groups of samples, Wilcoxon rank-sum tests were performed.
Transcriptional signature of BCG vaccination
To derive a signature of mouse LSK+CD150+ HSCs exposed to the BCG vaccine (BCG-iv)42, differential expression analysis was performed through DESeq2 (ref. 91) comparing BCG-iv versus control conditions. This resulted in 490 genes upregulated in BCG-exposed mouse HSCs at FDR < 0.05 and log2FC > 1, constituting a mouse HSC BCG-iv signature.
To derive a signature of human CD34+CD38−CD45RA− HSC–MPPs exposed to the BCG vaccine44, differential expression analysis was performed through DESeq2 comparing day 90 post-BCG vaccination versus day 0 pre-vaccination conditions. This resulted in 206 genes upregulated in HSC–MPPs at 90 days following BCG vaccination at FDR < 0.05 and log2FC > 1, constituting a human HSC–MPP BCG vaccination signature.
‘Akondy’ CD8 memory T cell signature
To derive a signature of functionally defined CD8 memory T cells47, differential expression was performed between TM cells and naive T cells, and between TM and Teff cells. From 937 genes enriched in TM versus naive T cells at log2FC > 1 and FDR < 0.01 and 1,543 genes enriched in TM versus Teff cells at log2FC > 1 and FDR < 0.01, we identified 257 overlapping genes significantly enriched in TM cells compared with both naive T and Teff cell subsets. These 257 genes represented the CD8 T cell memory signature. To derive a naive T signature, we utilized the same approach to identify 370 overlapping genes significantly upregulated in both naive T versus Teff cell and naive T versus TM cell comparisons. Owing to large gene set size, the top 200 genes were used for downstream signature scoring in xenograft HSCs.
Memory T cell signature from CITE-seq data
CITE-seq data of human T cell subsets were obtained49. Cell-type annotations and UMAP coordinates were also extracted from the original publication. Differential expression was performed on pseudobulk profiles with DESeq2 (v1.32.0), adjusting for donor as a covariate. To derive CD8 and CD4 T cell memory signatures, DEGs unique to both central memory T and effector memory T cell subsets compared with naive T at log2FC > 1 and FDR < 0.05 were retained, and the top 200 enriched genes were used as the signature.
ICU-COVID analyses and signature derivation
scMultiome of HSPCs in healthy control, ICU-control, and ICU-COVID donors were previously profiled50. Cells annotated as HSC–MPPs from this study were projected onto BoneMarrowMap, and transcriptional HSCs were purified in silico by reference map projection32. Differential expression analysis with DESeq2 (v1.32.0) was applied to pseudobulk profiles to compare HSCs from ICU-COVID donors against HSCs from ICU-control and healthy control donors, and 20 genes enriched in ICU-COVID at FDR < 0.05 were retained as an ICU-COVID recovery molecular signature. For analysis of monocytes in patients with ICU-COVID compared with healthy controls and ICU-controls, cells classified as CD14 monocytes and CD16 monocytes by reference map projection were retained, and pseudobulk-based differential expression was performed as outlined for the HSCs from these same donors.
Differential expression between HSC across age
Profiling of primary CD34+ bone marrow cells by scMultiome as described above yielded 43,762 cells with high-quality RNA and ATAC profiles spanning 6 donors: 2 young adult donors (20–30 years of age), 2 middle-aged donors (50–60 years of age) and 2 older-aged donors (70–80 years of age). In addition to this data, scRNA-seq data were compiled from 3 additional cohorts comprising bone marrow samples of varying ages: (1) 10X v2 and v3 scRNA-seq from CD34+ bone marrow profiled in Ainciburu et al.53, spanning 5 young adult donors (20–30 years of age) and 3 older-adult donors (60–80 years of age); quality control filtering as per Jakobsen et al.52 yielded a total of 71,805 cells. (2) STRT-seq from CD34+ fractions bone marrow profiled in Zhang et al.54 spanning 3 young adult donors (20–30 years of age) and 2 older-adult donors (60–90 years of age); quality control from the original study yielded 3,023 cells. (3) 10X v2 scRNA-seq from mixed CD34+ and bulk bone marrow profiled in 4 studies within BoneMarrowMap32 spanning 13 young adult donors (18–40 years of age) and 9 MA donors (40–60 years of age); quality control filtering as per the BoneMarrowMap publication yielded 194,905 cells.
Single-cell transcriptomes from each cohort were classified by BoneMarrowMap projection, and transcriptional HSCs were purified in silico for downstream analysis. Collectively, this constituted 23,048 transcriptional HSC spanning 23 young adult donors, 11 middle-aged donors and 7 older-aged donors. Pseudobulk profiles were constructed from HSCs from each donor sample, and differential expression was performed between HSCs from middle-aged and older-aged donors and HSCs from young adult donors using DESeq2.
Aged HSC meta-signature derivation
To derive a meta-signature of aged HSCs spanning all datasets, donor-specific HSC pseudobulk profiles from each dataset were pooled together. Differential expression was performed between HSCs from 18 middle-aged and/or older-aged donors and HSCs from 23 young adult donors, adjusting for the originating dataset as a covariate. Before interpretation of differential expression results, 370 genes that were upregulated in aged HSCs at log2FC > 0 within each of the 4 ageing datasets were retained. Among these 370 universally upregulated genes, 37 were significantly upregulated in aged HSCs by pooled differential expression at log2FC > 1 and FDR < 0.05. These 37 genes represent a meta-signature that is consistently upregulated across human HSC ageing.
TARGET-seq+ clustering and cell-type mapping
TARGET-seq+ profiling, scRNA-seq preprocessing and cell-type annotation of human bone marrow HSPCs from CH and control donors are outlined in the original study52. Gene identifiers were converted to Ensembl v93 and HSCs were annotated by projecting the dataset onto the bone marrow reference map as described above. The HSC–MPP, LMPP, LMPP cycling and erythroid/megakaryocytic-primed MPPs (EMPP) clusters from our original study52 were further subclustered using the self-assembling manifolds (SAMs) algorithm (v1.0.1), using default settings with Harmony-adjusted principal components as input and using the sample identifier as the batch101. The resulting SAM-weighted PCA was then used as input to generate a UMAP and for Louvain clustering, which identified seven clusters.
For calculating the HSC2:HSC1 cell ratio, the number of cells in each cluster was calculated on a per-sample basis. Only cells sorted as part of the total Lin–CD34+ gate were included, to avoid bias introduced by FACS depletion of CD38– cells.
Differential expression in CH TARGET-seq+ data
Differential expression testing was performed with a linear mixed model to account for sample covariance using the dream pipeline from the variancePartition package99 (v1.22.0), which is based on limma-voom102. Testing was performed on log-normalized counts, using the scran normalization size factors. Genes were filtered to include only those expressed in at least 10% of cells in either group. A linear mixed model was fitted to each gene using ‘dream’, and differential expression testing was performed using ‘variancePartition::eBayes’ (variancePartition v1.33.0). For comparisons between CH and non-CH controls, the sample type was used as the test variable, and the sample identifier, age, sex and FACS-sorting plate batch effects included as covariates. For comparisons between HSC1 and HSC2, the cell type was used as the test variable, and sex was included as a covariate. For comparisons between genotypes within CH samples, the clone was used as the test variable, and the sample identifier and FACS-sorting plate batch effect included as mixed-effect covariates. For differential expression analysis between HSC1-dominant and HSC2-dominant hierarchies, the dominant HSC group was used as the test variable, and the sample identifier, sex and FACS-sorting plate batch effects included as random effect covariates.
SCENIC analysis of TARGET-seq+ data
To infer transcription factor regulon activity, regulon analysis was performed using pySCENIC (v0.12.0)83, which was run as per previously published workflow guidelines. To identify candidate transcription factor regulons, filtered and pre-processed raw counts were used as the input alongside a list of human transcription factors98. Candidate regulons were pruned using the annotations of transcription factor motifs ‘motifs-v10nr_clust-nr.hgnc-m0.001-o0.0.tbl’, and CisTarget was applied using the ‘mc_v10_clust’ databases of known human transcription factor motifs annotated at: (1) 500 bp upstream and 100 bp downstream of the transcription start site (TSS); and (2) 10 kb centred around the TSS. No drop-out masking was applied. Enrichment of refined transcription factor regulons was quantified using AUCell, with default parameters. Tests for differential regulon activity were performed using a linear mixed model, as described above.
Signature enrichment in TARGET-seq+ data
Differences in gene expression signature or transcription factor regulon scores between conditions were tested by a linear mixed model. For comparisons between CH and non-CH controls, the sample type was used as the fixed effect, and the sample identifier, age, sex and FACS-sorting batch as mixed-effect covariates. For comparisons between genotypes within CH samples, the clone was used as the fixed effect, and the sample identifier as a mixed-effect covariate. P values were obtained by a likelihood ratio test of the full model with the fixed effect against the model without the fixed effect.
Bone marrow xenografts and TARGET-seq+
Bone marrow samples were collected from individuals undergoing elective total hip replacement surgery at the Nuffield Orthopaedic Centre under the Mechanisms of Age-Related Clonal Haematopoiesis (MARCH) Study, as described52. Written informed consent was obtained from all participants in accordance with the Declaration of Helsinki with approval by the Yorkshire & The Humber–Bradford Leeds Research Ethics Committee (NHS REC ref: 17/YH/0382). Bone marrow CD34+ cells purified using a CD34 MicroBead kit (Miltenyi Biotec) according to the manufacturer’s instructions were transplanted as for CB samples into irradiated NSG-SGM3 animals at 55,000–90,000 CD34-enriched cells per animal by intrafemoral injection. Mice were treated with PBS or 5 μg TNF at 2 weeks and 10 weeks post-transplantation. Human engraftment was assessed at 12 weeks post-transplantation as described above for CB and cells cryopreserved for downstream analysis. After mouse depletion (Miltenyi), samples were stained for FACS (see Supplementary Table 22) to pre-sort for hCD45+hCD34+hCD19−hCD33− HSPCs and hCD45+CD33+CD34−CD19− myeloid cells on a BD Fusion instrument. The NOC153 bone marrow sample was included as a technical control for each sort of a xenografted sample. Pre-sorted subpopulations underwent single-cell index sorting on a Sony MA900 into 384-well plates containing 3 µl lysis buffer for downstream library preparation and computational analysis as previously described with the comparable samples from the original TARGET-seq+ dataset52.
GSEA analysis in human acute myeloid leukaemia
Comparison of BoneMarrowMap-defined HSC–MPP from acute myeloid leukaemia samples versus healthy controls. scRNA-seq data generated from six studies with (1) clinical information on DNMT3A and TET2 status, and (2) internal healthy control samples, were included32,103,104. This constituted 91 acute myeloid leukaemia samples and 16 healthy control samples. From these 91 samples, 15 were clinically annotated as DNMT3A-MUT, 18 were clinically annotated as TET2-MUT, 35 were clinically annotated as WT for both DNMT3A and TET2 (double negative), and the remaining were not annotated for DNMT3A or TET2 mutation status. Pseudobulk profiles were obtained at the level of the HSC–MPP populations from each patient sample, and differential expression was performed with DESeq2 between acute myeloid leukaemia HSC–MPP and healthy HSC–MPP while controlling for study as a covariate.
Myeloid and progenitor scRNA-seq QC and preprocessing
Raw sequencing data were pre-processed with CellRanger-ARC (v2.0.0) and aligned to GRCh38. The RNA feature count matrix for each sample was corrected for ambient RNA contamination using SoupX (v1.6.2)79 with default parameters. SoupX-corrected RNA counts were processed using Seurat (v4.3.0) and the following quality control-filtering thresholds were applied to each sample: percentage of mitochondrial genes (pct_mito) < 10% and number of unique RNA transcripts detected (nFeature_SoupX) > 300. After initial quality control, single-cell transcriptomes were normalized by scran (v1.20.1), followed by variable feature selection, scaling and PCA reduction. Batch correction with Harmony (v0.1.1)85 was performed with sex as a batch variable. A UMAP reduction was performed using 20 Harmony-corrected principal components, and a neighbourhood graph was constructed using the top 30 neighbours for each cell. Louvain clustering was performed at a resolution of 1.4, and clusters were condensed by concordance for predicted cell-type annotations upon mapping to the BoneMarrowMap32. Neutrophil progenitors were validated by evaluating expression for MPO and ELANE.
Inferring genetic clonal groups using SoupOrCell
To exploit the extensive genetic heterogeneity within the 20-week xenograft data, we utilized SoupOrCell (v2.5), a tool that performs unsupervised clustering of genetic polymorphisms from the raw sequencing data within a single-cell experiment to capture this genetic heterogeneity as barcodes for lineage tracing. To combine the raw sequencing data from the CD34+CD38−CD45RA− HSPCs with newly generated scRNA-seq data from CD34+CD38− progenitors and CD33+ mature myeloid cells isolated from these same xenografts, we merged the gene expression bam files from CellRanger-ARC (v2.0.0) using pysam (v0.15.1). Merged bam files were sorted and indexed using samtools (v1.17) with default parameters. SoupOrCell was iteratively run across a parameter search from k 1–30, and the optimal number of genetic clonal groups was evaluated using an elbow plot of the total log likelihood and concordance with predicted sex assignments.
Clonal groups were assigned as HSC-I dominant, HSC-iM dominant and nonspecific based on cell composition within the HSC pool. Specifically, clonal groups with more than 95% HSC-iM or HSC-I within the HSC pool were assigned as HSC-iM dominant and HSC-I dominant, respectively. Remaining clonal groups (HSC-iM proportions ranging from 12% to 60% in the HSC pool) were assigned as nonspecific. For differential expression analysis between HSC-I-dominant and HSC-iM-dominant clonal groups, pseudobulk profiles were constructed from each cell type within each clonal group within each treatment condition, and DESeq2 (v1.32.0) was applied to pseudobulk profiles comparing HSC-iM-specific clones against HSC-I-specific clones for each cell type. GSEA was performed using the fgsea (v1.18.0) package. Before differential expression, pseudobulk profiles consisting of less than five cells were filtered out.
Donor-level associations between HSCs and monocytes
To indirectly infer associations between transcriptional features of monocytes against HSC-iM program enrichment from upstream HSCs, scRNA-seq data from three scRNA-seq datasets of bulk mononuclear cells within BoneMarrowMap32 were used105,106,107. First, HSCs and CD14 monocytes from each donor were collapsed into pseudobulk profiles, and only healthy donors with 5 or more HSCs as well as 5 or more monocytes were included, leading to 32 donors used for this analysis. For each donor, the mean enrichment score for the HSC-iM program (top 200 genes scored by AUCell) within the HSC pool was obtained. Next, using the pseudobulk transcriptome for the monocytes from each donor, DESeq2 was applied to regress the monocyte transcriptomes against a continuous variable representing enrichment of the HSC-iM program within the HSC pool. Test statistics and P values were obtained for each gene within the monocyte transcriptome, and these statistics were used to construct a rank list for downstream GSEAs. Positive-test statistics translate to higher expression of a given gene in the monocytes of donors with greater HSC-iM enrichment within their upstream HSCs.
Clone-level associations between HSCs and monocytes
To more directly infer associations between transcriptional features of monocytes against HSC-iM program enrichment from upstream HSCs, we utilized a native lineage-tracing dataset integrating mitochondrial DNA variant-based lineage tracing with concomitant multi-omic profiling of HSCs8. Pre-processed single-cell transcriptomes from their dataset were projected onto BoneMarrowMap32 to identify HSCs and CD14 monocytes. Next, among mitochondrial DNA-defined clones assigned from their study, we identified clones with at least three HSCs and at least three CD14 monocytes. This resulted in retention of 213 clones spanning 13 donors, which was used for association analysis. For each clone, the mean enrichment score for the HSC-iM program (top 200 genes scored by AUCell) within the HSC pool was obtained. Next, using the pseudobulk transcriptomes for the monocytes from each clone, DESeq2 was applied to regress the monocyte transcriptomes against a continuous variable representing enrichment of the HSC-iM program within the HSC pool. Test statistics and P values were obtained for each gene within the monocyte transcriptome, and these statistics were used to construct a rank list for downstream GSEAs. Positive-test statistics transplate to higher expression of a given gene in the monocytes of clones with greater HSC-iM enrichment within their upstream HSCs.
BM xenograft TARGET-seq+ data processing
Raw sequencing data were preprocessed with the TARGET-seq+ pipeline (https://github.com/asgerjakobsen/TARGET-seq-plus) as previously described52,108. In brief, transcriptome data were preprocessed with a custom pipeline (https://github.com/asgerjakobsen/TARGET-seq-plus-RNA) to trim and demultiplex reads into single-cell barcodes using cutadapt (v3.4) and then mapped them to the hg38 reference genome and ERCC92 transcripts with STAR (v2.7.10a) using the GENCODE v38 reference gene annotation. Genotyping amplicon data were demultiplexed and processed to generate tables of allelic counts, which were used to call cell genotypes as previously described52 using single-cell data from the NOC153 primary bone marrow sample as WT controls. Finally, FACS indexing, genotyping and transcriptome data were integrated for downstream analysis in Seurat (v5.3.0).
The following quality control filters were applied to the starting dataset of 10,640 cells: minimum of 5,000 RNA reads per cell, minimum of 1,000 genes per cell, maximum percentage of mitochondrial reads = 15% and maximum percentage of ERCC reads = 65%, leaving 8,998 cells remaining. The filtered data were integrated with the 13,247 primary bone marrow cells from the original TARGET-seq+ dataset52. Genes expressed in fewer than 10 cells were removed and reads were normalized by scran (v1.36.0) using the pool normalization method with prior clustering, followed by variable feature selection, scaling and PCA reduction. Batch correction with Harmony (v1.2.3) was performed with sample donor and experimental batch as batch variables. A UMAP reduction was performed using 30 Harmony-corrected principal components. Louvain clustering was performed at a resolution of 1. Clusters were annotated and condensed by concordance with predicted cell-type annotations upon mapping to the BoneMarrowMap along with the cell-type annotations from the original primary bone marrow dataset and immunophenotypic profiles.
Inference of HSC origin in TARGET-seq+ data
To identify HSC-I-derived and HSC-iM-derived cells, we first defined a set of genes that distinguish the differentiation trajectories of HSC-I-dominant and HSC-iM-dominant primary bone marrow samples in the original TARGET-seq+ dataset. Within each cell type, single-cell transcriptomes from each donor were collapsed into pseudobulk profiles, and EdgeR was used to identify genes differentially expressed between HSC-I-dominant (n = 6) and HSC-iM-dominant (n = 4) samples. We selected genes that were differentially expressed at FDR < 0.10 within 5 or more cell types, generating a list of 702 genes. We then performed dimensionality reduction and clustering of HSPCs and monocytic cell types in the integrated TARGET-seq+ dataset using the SAM algorithm and the 702 HSC-I and HSC-iM trajectory genes. Louvain clustering was performed on the SAM embeddings at a resolution of 1.5, generating 15 clusters. These clusters were then annotated as being of HSC-I or HSC-iM origin based on the composition of primary bone marrow cells from HSC-I-dominant and HSC-iM-dominant samples and expression of the HSC-I and HSC-iM transcriptional programs.
For analysis of monocytic output in bone marrow xenografts, the number of early HSPC cells (HSC–MPP, LMPP, cycling progenitor and early GMP) and monocytic cells (late GMP, promonocytes and monocytes) were calculated separately for each sorted population (CD34+ and CD34–CD33+), and the CD34–CD33+ counts then multiplied by the ratio of CD34–CD33+:CD34+ cells in FACS-sorting gates to account for the size of each population in the xenograft sample. The frequency of monocytic cells was then divided by the frequency of early HSPCs to obtain a relative abundance.
scRNA-seq in the OHS to relate HSC-iM to IRS
Study population
CanPath is a population cohort of over 330,000 participants across 7 provinces in Canada, and has collected information on health, lifestyle, disease and environmental factors along with biological samples. Requests for access to CanPath data should be made through the data access portal (https://portal.canpath.ca/).
Sample selection
A modified version of the IRS (mIRS) was calculated for all participants using the sex-specific 5-year mortality risk coefficients for six values on a complete blood count: haematocrit, white blood cell count, platelet count, mean corpuscular volume, mean corpuscular haemoglobin concentration and red blood cell distribution width. The age component was excluded from the calculation to enable direct comparisons of blood cell profiles among participants of all ages, and the metabolic parameters were also excluded. The complete blood count-based mIRS has been shown to be associated with all-cause mortality in a cohort of approximately 30,000 participants109, as well as a randomized trial population of approximately 17,000 (ref. 110). Participants with any of the following self-reported diseases were excluded: high blood pressure, myocardial infarction, stroke, asthma, emphysema, chronic bronchitis, chronic obstructive pulmonary disorder, depression, diabetes, liver cirrhosis, chronic hepatitis, Crohn’s disease, ulcerative colitis, irritable bowel syndrome, eczema, systemic lupus erythematosus, psoriasis, multiple sclerosis, osteoporosis, arthritis and cancer. Samples were further filtered to retain only those with European ancestry, and those that were 45 years of age or younger, or 65 years of age or older, classified as young and aged, respectively. For extreme sampling, both the young and the aged groups were ranked according to their age and mIRS, and the top and bottom approximately 100 samples from each age group were retained for molecular phenotyping.
scRNA-seq library preparation, sequencing and data preprocessing
Tissue thawing medium (TTM) was prepared by mixing 10% FBS, 25 mM HEPES, 55 μM 2-mercaptoethanol and 1 mM sodium pyruvate, warmed to 37 °C. Buffy coat samples were thawed in a 37 °C water bath for approximately 2 min until a small ice crystal remained. Then, 1 ml TTM at 37 °C supplemented with 25 U ml−1 benzonase was added dropwise to the thawed sample. The cells were centrifuged at 600g for 8 min at room temperature. The supernatant was removed, and the cells were resuspended in 10 ml of TTM at 37 °C supplemented with 25 U ml–1 benzonase. The cells were incubated for 15 min at 37 °C. The cells were then centrifuged at 300g for 8 min at room temperature, and resuspended in 1 ml of FBS at 37 °C. The concentration of the cell suspension and viability was assessed using the TC20 Cell Counter (Bio-Rad) with trypan blue staining. The concentration of the cell suspension was adjusted to 1 × 10⁶ cells per millilitre. The cells were left to recover for 30–60 min at 37 °C, after which CD45+ cells were isolated using MACS (Miltenyi Biotec) following the manufacturer’s protocol.
scRNA library preparation and sequencing were performed by the Genomics platform at the Ontario Institute for Cancer Research. From the isolated CD45+ single-cell suspension, 4 × 10³ cells were used to construct libraries with the Chromium Single-Cell 3′ Reagent Kit with v2 chemistry (10X Genomics) following the manufacturer’s protocols. Single-indexed libraries were sequenced on the Illumina Novaseq platform with the following parameters: read 1 for 26 cycles, i7 index for 8 cycles and read 2 for 98 cycles. CellRanger (v3.0.0) –mkfastq was used to demultiplex BCL files and generate a fastq file for each scRNA-seq sample. Then, –count was used to align the fastq files to the hg38 reference, filter out barcodes for empty gel bead-in-emulsion, and generate a cell unique molecular identifier × gene matrix, which was used in downstream data analyses.
Single-cell data quality control, filtering and annotation
The following quality control filters were applied to the total starting dataset of 619,925 cells: a minimum of 300 genes per cell, a minimum of 10 cells per gene and maximum percentage of mitochondrial DNA = 20%, leaving 438,986 cells remaining. Samples were then downsampled within each risk group (young low risk, young high risk, aged low risk and aged high risk) such that the number of male and female individuals was equal within each risk group. Cell-type annotation was performed using BoneMarrowMap32. Annotations were grouped to form six cell-type categories: naive T cells, B cells, natural killer cells, dendritic cells, CD14 monocytes and CD16 monocytes. We removed memory T cells from analysis due to the potential for confounding effects introduced by T cell-specific memory, given its similarity to the HSC-iM program.
Scoring of HSC-I and HSC-iM signatures to predict IRS
Cell-type-specific pseudobulk profiles were created using decoupler (v2.0.2), with the ‘sum’ mode. Only samples with a minimum of 10 cells and 1,000 total counts were retained. The pseudobulked data were log normalized and scaled using default settings with scanpy.pp.normalize_total, scanpy.pp.log1p and scanpy.pp.scale. The top 200 genes in the HSC-I and HSC-iM signatures were scored on each cell-type-pseudobulk profile using scanpy.tl.score_genes. For each cell type, a generalized linear model was constructed to predict high risk or low risk (high or low risk ~ HSC-I or HSC-iM score + batch + sex + age), and regressions were conducted separately among young samples and aged samples. P values from each regression were adjusted for multiple testing using the Benjamini–Hochberg procedure, within the young and aged groups, using a significance threshold of FDR < 0.05.
Statistical testing and data presentation
Graphpad Prism (v9.2-10.6) was used to plot biological data and perform statistical testing as specified in the respective figure legends. Bioinformatic data were plotted and compared using R (v4.1.0-4.5.2 with packages ggplot2 v3.5.1-4.0.0, dplyr v1.1.4 and tidyverse v2.0.0) or Python3 (v3.11 with NumPy v2.2.5) as indicated in the respective sections in the Methods. Figure panels were assembled and most schematics were created using Microsoft Powerpoint (v16).
Reporting summary
Further information on research design is available in the Nature Portfolio Reporting Summary linked to this article.

