


Compounds
dBET6 (HY-112588), dBRD9 (HY-117690), MLN7243 (HY-100487), MLN4924 (HY-70062), MG132 (HY-13259), bafilomycin A1 (HY-100558), and 5K Scaffold Library (HY-L902) were obtained from MedChemExpress.
Plasmids
The following plasmids were used in this study: Artichoke (Addgene #73320) and Cilantro (Addgene #74450) for flow-based reporter degradation assays, reporter CRISPR screens and co-immunoprecipitation; sgBFP (U6.sgRNA.SFFV.tBFP) for validation of DCAF11-knockout phenotypes; pNTM2 (CMV) for co-immunoprecipitation; pAC8-derived plasmids for protein purification. All proteins are derived from human origin sequences: full-length DCAF11, DDX18 (residues 171–625), DDB1(ΔBPB) (residues 1–395 and 706–1140 with a GNGNSG linker) and full-length DDA1. Unique amino acid tags: Flag (for DCAF11, DDX18), Flag–GFP (for DDX18), StrepII–Avi (for DCAF11 and DDX18) and His (for DDB1(ΔBPB) and DDA1) were designed to the N-terminal ends of the constructs, and then subcloned into pAC-derived expression vectors (pAC8RedNK)45.
Antibodies
The following antibodies were used: Flag (CST 14793S), GFP (CST 2555S), β-actin (CST 3700S), tubulin (Sigma T9026), BRD4 (Bethyl A301-985A-T), DDX18 (GeneTex GTX103392), BRD9 (Bethyl, A303-781A-T), SMARCA2 (Bethyl A301-015A-T), LIMK2 (CST 3845 T), WEE1 (CST 4936S), CDK7 (Proteintech 27027-1-AP), cyclin H (Proteintech 67065-1-lg), MNAT1 (Proteintech 11719-1-AP), DCAF11 (Novus Biologicals NBP2-92244), IRDye 800CW Goat anti-Rabbit IgG Secondary Antibody (LI-COR 926-32211) and IRDye 680LT Goat anti-Rabbit IgG Secondary Antibody (LI-COR 925-68021).
Protein expression and purification
The recombinant proteins from the constructs in pAC-derived vectors were expressed in Trichoplusia ni High Five insect cells (Gibco, 85502) using the baculovirus expression system. In brief, expression plasmids were transfected into Spodoptera frugiperda (Sf9) cells (Expression Systems, 94-001 F) at a density of 0.9 × 10⁶ cells per ml grown in ESF 921 medium (Expression Systems) to generate baculovirus, and this was followed by 2 rounds of infection in Sf9 cells to increase viral titre. For recombinant protein expression, High Five cells grown in SF-4 baculo express insect medium (BioConcept) at a density of 2.0 × 10⁶ cells per ml were infected with baculovirus at 1.5% v/v ratio. After 42 h of expression at 27 °C, High Five cells were collected by centrifugation for 15 min at 1,500 rpm. For purification of StrepII or Flag-tagged proteins, pelleted cells were resuspended in lysis buffer containing 50 mM Tris (hydroxymethyl) aminomethane hydrochloride (Tris-HCl) pH 8.0, 200 mM NaCl, 1 mM Tris (2-carboxyethyl) phosphine (TCEP), and protease inhibitors, and the cell pellets were lysed by sonication. After ultracentrifugation (1 h, 40,000 rpm, 4 °C), the soluble fraction was passed over the appropriate affinity resin of Strep-Tactin XT Superflow (IBA 2-4010-025) or Anti-DYKDDDDK G1 Affinity Resin (Genscript L00432), eluted with wash buffer (50 mM Tris-HCl pH 8.0, 200 mM NaCl, 1 mM TCEP) supplemented with 50 mM Biotin (IBA 2-1016-005) or 0.15 mg ml−1 Flag peptide (custom synthesis), respectively. The affinity-purified proteins were then applied to an ion exchange column (POROS 50HQ, Thermo Scientific 1255911) and eluted in 50 mM Tris-HCl pH 8.5 and 2 mM TCEP by a linear salt gradient (from 50 mM to 1000 mM NaCl). All proteins were then subjected to size-exclusion chromatography on a Superdex 200 Increase 10/300 (Cytiva 28990944) in 25 mM 4-(2-hydroxyethyl)-1-piperazineethanesulfonic acid (HEPES) pH 7.4 or pH 8.0, 150 mM NaCl and 1 mM TCEP. For structural biology studies, the non-concentrated peak fraction was used, whereas for biochemistry studies, protein within the peak was pooled, concentrated, and flash frozen in liquid nitrogen and stored at −80 °C.
Biotinylation
Purified StrepII–Avi-tagged DCAF11 or DDX18 were biotinylated in vitro by incubation with final concentrations of 2.5 μM BirA enzyme (prepared in-house) and 0.2 mM biotin in 50 mM HEPES, pH 7.4, 200 mM NaCl, 10 mM MgCl2, 1 mM TCEP and 20 mM ATP. The reaction was incubated for 1 h at room temperature and stored overnight at 4 °C. Biotinylated proteins were purified by size-exclusion chromatography and flash frozen in liquid nitrogen and stored at −80 °C.
TR-FRET
Titrations of compounds to induce the DCAF11–DDX18 complex were carried out by mixing biotinylated DCAF11 and GFP–DDX18 at the concentration described in the figure legend, and 2 nM terbium-coupled streptavidin (prepared in-house) in an assay buffer containing 50 mM HEPES pH 8.0, 200 mM NaCl, 1 mM TCEP, 0.05% Tween-20, and 1 mM TCEP. For lysate buffer, 2 × 10⁷ HEK293T cells were lysed by sonication. After centrifugation (15,000 rpm, 30 min, 4 °C), the soluble fraction was used as a lysate buffer. For GST and GSH-mediated TR-FRET, 0.5 mg ml−1 GST and 0.2 mg ml−1 of reduced GSH were used. After dispensing the assay mixture (15 μl volume), increasing concentrations of compounds were dispensed in a 384-well microplate (Corning 4514) using a D300e Digital Dispenser (HP) and then incubated for 1 h at room temperature. After excitation of terbium fluorescence at 337 nm, emission at 490 nm (terbium) and 520 nm (GFP) were recorded with a 70-μs delay over 600 μs to reduce background fluorescence, and the reaction was followed over 60 cycles of each data point using a PHERAstar FS microplate reader (BMG Labtech). The TR-FRET signal of each data point was extracted by calculating the 520/490 nm ratio. The dose-dependent TR-FRET curve was generated using GraphPad Prism. The number of technical replicates is indicated in the figure legend.
Titrations of BODIPY-labelled M12, BODIPY-labelled GSH or GFP–DDX18 were carried out by mixing biotinylated DCAF11 (or biotinylated DDX18) at the concentration described in the figure legend, and 2 nM terbium-coupled streptavidin in the same assay buffer or lysate buffer. After dispensing the assay mixture, an increasing concentration of BODIPY-M12 was dispensed in the 384-well plate using a D300e Digital Dispenser then incubated for 1 h at room temperature. The 520/490 nm ratios from the sample with biotinylated proteins were subtracted by the ratios from the sample without proteins, and the subtracted values were plotted using GraphPad Prism. The number of technical replicates is indicated in the figure legend.
Multiplexed immunoprecipitation and sample preparation for mass spectrometry analysis
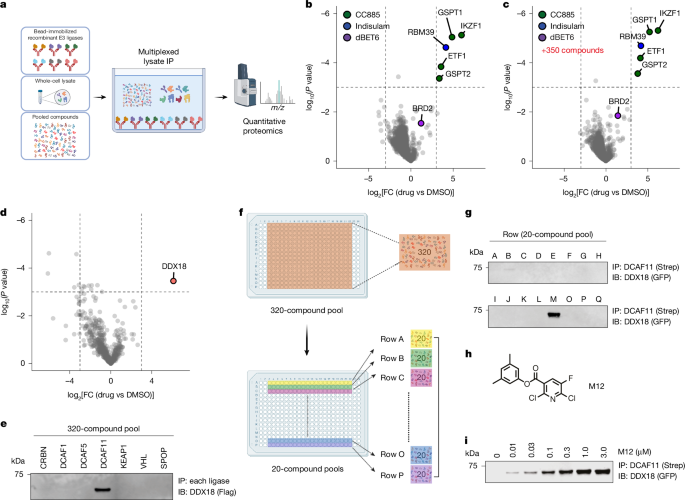
DMSO, CC-885 (positive control, 31.25 µM, 6 µl per well) or pools of 320 drugs (31.25 µM, 6 µl per well) were dispensed into a 96-well plate in triplicate. A total of 1 × 10⁹ frozen cells (8 × 10⁸ Expi293, 5 × 10⁷ K562, 1 × 10⁸ U937 and 5 × 10⁷ Hep3B cells) were resuspended in 20 ml lysis buffer (50 mM Tris pH 8.0, 200 mM NaCl, 2 mM TCEP, 0.1% NP-40, 2 µl Benzonase (EMD Millipore 77664-3), and 1 tablet of cOmplete protease inhibitor cocktail). The suspension was sonicated on ice for 20 cycles (3 s on, 5 s off) at 25% amplitude. After centrifugation, 504 µl of each of 7 bait proteins (15 µM each) were added to 9.5 ml of clarified lysate. Then, 125 µl of the lysate–protein mixture was added to each well of the pre-plated 96-well PCR plate containing compounds. The plate was incubated on ice for 1 h, followed by addition of 50 µl pre-washed MagStrep Strep-Tactin XT beads (IBA 2-5090-010) to each well (final composition: 90 µl lysate, 6 µl compound pool, 25 µl protein, 50 µl resin; final concentration of each drug: 1.1 µM). The mixture was incubated for an additional hour on ice. Beads were washed using wash buffer (50 mM Tris pH 8.0, 2 mM TCEP) containing the corresponding compound pool, and elution was performed using 0.5 M NaOH. The eluate was immediately neutralized with 0.1 M Tris pH 2.0 to achieve a final pH of 8.5 and a final volume of 200 µl.
Samples were reduced with TCEP (final concentration 10 mM) for 30 min at room temperature on a thermomixer, followed by alkylation with iodoacetamide (Sigma I1149, final concentration 15 mM) for 45 min, protected from light. The reaction was quenched with 1 M DTT (final concentration 10 mM). Subsequently, proteins were digested with 3 µg of Trypsin/Lys-C Mix, Mass Spec Grade (Promega V5072) overnight at 37 °C. Sample digests were acidified with formic acid to a pH of 2–3 prior to desalting using C18 solid phase extraction plates (Thermo Scientific 60307). Desalted peptides were dried in a vacuum-centrifuged and reconstituted in 0.1% formic acid for LC–MS analysis. Data for multiplexed immunoprecipitations were collected following the DDA methods described below. Data for non-multiplexed immunoprecipitations were collected following the diaPASEF methods described below.
Sample preparation for whole-cell quantitative proteomics
Treated cells were lysed by addition of lysis buffer (8 M urea, 50 mM NaCl, 50 mM 4-(2-hydroxyethyl)-1-piperazineethanesulfonic acid (EPPS) pH 8.5, protease and phosphatase inhibitors) and homogenization by bead beating (BioSpec) for three repeats of 30 s at 2,400 strokes per min. Protein quantification, tryptic digestion and C18 desalt was performed following procedures described46. Data for whole-cell quantitative proteomics were collected following the diaPASEF methods described below.
LC–MS data collection and analysis using diaPASEF
Data were collected on a TimsTOF HT (Bruker Daltonics) coupled to a nanoElute2 LC pump (Bruker Daltonics) as described19,46. The diaPASEF raw file processing and false discovery rate analysis was performed using library free analysis in DIA-NN47 searched against a Swiss-Prot human database (January 2021) using the default settings for directDIA, which include the following: tryptic with two missed cleavages, carbamidomethylation of cysteine, and oxidation of methionine and precursor Q-value (false discovery rate) cut-off of 0.01. Precursor quantification strategy was set to Robust LC (high accuracy) with retention time-dependent cross run normalization.
For global proteomics, proteins with low sum of abundance (<2,000× no. of treatments) were excluded from further analysis and resulting data was filtered to only include proteins that had a minimum of 3 counts in at least 3–4 replicates of each independent comparison of treatment sample to the DMSO control.
For multiplexed immunoprecipitation proteomics: Resulting data was filtered to only include proteins that had a minimum of three precursor counts in at least four replicates of each independent comparison of treatment sample to the DMSO control. Protein abundances were globally normalized using in-house scripts in the R framework.
Proteins with missing values were imputed by random selection from a Gaussian distribution either with a mean of the non-missing values for that treatment group or with a mean equal to the median of the background (in cases when all values for a treatment group are missing). Significant changes comparing the relative protein abundance of the treatment to DMSO control comparisons were assessed by two-sided moderated t-test as implemented in the limma package within the R framework43.
LC–MS data collection and analysis using DDA
Data were collected using an Orbitrap Exploris 480 mass spectrometer (Thermo Fisher Scientific) coupled with an UltiMate 3000 RSLCnano System. Peptides were separated on an Aurora 25 cm × 75 μm inner diameter microcapillary column (IonOpticks), and using a 60 min gradient of 5–25% acetonitrile in 1.0% formic acid with a flow rate of 250 nl min−1. Each analysis used a TopN data-dependent method. The data were acquired using a mass range of m/z 350–1,200, resolution 60,000, 300% normalized AGC target, auto maximum injection time, dynamic exclusion of 30 s, and charge states of 2–6. TopN 40 data-dependent MS2 spectra were acquired with a scan range starting at 110 m/z, resolution 15,000, isolation window of 1.4 m/z, HCD normalized collision energy set at 30%, standard AGC target and the automatic maximum injection time.
Data were collected using an Orbitrap Eclipse mass spectrometer (Thermo Fisher Scientific) coupled with an UltiMate 3000 RSLCnano System. Peptides were separated on a 50 cm, 75 μm inner diameter EasySpray ES903 microcapillary column (Thermo Fisher Scientific), and using a 60 min gradient of 6–22% acetonitrile or a 60 min gradient of 5–25% acetonitrile in 1.0% formic acid with a flow rate of 350 nl min−1. Each analysis used a cycle time-based data-dependent acquisition method with a total cycle time of 3 s. Full MS1 scans were acquired in the orbitrap at a resolution of 120,000 over a mass range of m/z 375–1,325, with a maximum injection time of 200 ms and AGC target of 4 × 10⁵ (normalized 100%). Precursors with charge states of 2–6 and intensity above 20,000 were selected for fragmentation, with 30 s dynamic exclusion. MS1 scans were acquired in the orbitrap at a resolution of 30,000 using HCD fragmentation with a normalized collision energy of 35%, quadrupole isolation window of 0.5 m/z and 54 ms maximum injection time. The AGC target for MS2 scans was 5 × 10⁴ (normalized 100%), and data were collected in centroid mode.
Proteome Discoverer 2.4 or 2.5 (Thermo Fisher Scientific) was used for processing of RAW files and controlling peptide and protein level false discovery rates, assembling proteins from peptides, and protein quantification from peptides. MS/MS spectra were searched against a Swiss-Prot human database (January 2021) with both the forward and reverse sequences, as well as with known contaminants, such as human keratins. Database search criteria were as follows: tryptic with two missed cleavages, a precursor mass tolerance of 10 ppm, fragment ion mass tolerance of 0.03 or 0.06 Da, static alkylation of cysteine (57.0215 Da) and variable oxidation of methionine (15.9949 Da), N-terminal acetylation (42.0106 Da) and with or without phosphorylation of serine, threonine and tyrosine (75.966 Da). Peptides were quantified using the MS1 Intensity, and peptide abundance values were summed to yield the protein abundance values. Resulting data was filtered to only include proteins that had a minimum of 2 counts in at least 2 replicates of each independent comparison of treatment sample to the DMSO control. Protein abundances were globally normalized using in-house scripts in the R framework. Proteins with missing values were imputed by random selection from a Gaussian distribution either with a mean of the non-missing values for that treatment group or with a mean equal to the median of the background (in cases when all values for a treatment group are missing). Significant changes comparing the relative protein abundance of the treatment to DMSO control comparisons were assessed by two-sided moderated t-test as implemented in the limma package within the R framework43.
Quantitative PCR
A total of 1 × 10⁶ Jurkat cells were treated with DMSO or 20 µM M12 for 18 h, collected by centrifugation, washed with phosphate-buffered saline (PBS) and flash frozen in −80 °C. mRNA was isolated using the QIAGEN RNeasy Plus (Qiagen 74134). For cDNA synthesis, 1 µg of RNA was reverse-transcribed with iScript cDNA Synthesis Kit (Bio-Rad, 1708891) and before quantitative PCR analysis with TaqMan Gene Expression Master Mix (Applied Biosystems 4369016) for DDX18 (Life Technologies TaqMan Hs00705691_s1) and GAPDH (TaqMan, Hs02786624_g1). Reactions were run and analysed on the QStudio 6 FLX Real-Time PCR System (Applied Biosystems). Fold expression was calculated using the ∆∆Cq method by normalizing cycle threshold (Cq) values to the GAPDH reference gene and the M12-treated sample to the DMSO sample.
Immunoblots
Cells were washed with PBS and lysed in RIPA lysis buffer (Thermo Scientific 89901) with cOmplete Protease Inhibitor Cocktail (Sigma 11836170001) for 20 min on ice. The insoluble fraction was removed by centrifugation; the protein concentration was quantified using a BCA protein assay kit (Thermo Scientific 23227); and an equal amount of lysate was run on SDS–PAGE 4–12% Bis-Tris protein gels (Thermo Scientific) and then transferred to nitrocellulose membrane with an XCell II Blot Module Wet Tank Transfer System (Thermo Scientific). Membranes were blocked in Intercept (PBS) Blocking Buffer (LI-COR Biosciences 927-70001) and incubated with primary antibodies overnight at 4 °C. The membranes were then washed in Tris-buffered saline with Tween-20 (TBS-T), incubated for 1 h with secondary IRDye-conjugated antibodies (LI-COR Biosciences) and washed three times in TBS-T for 5 min before near-infrared western blot detection on an Odyssey Imaging System with Image Studio software (LI-COR Biosciences).
Co-immunoprecipitation
Five million HEK293T cells expressing DDX18–eGFP in Cilantro were plated in 10 cm dishes. After 1 day, cells were transiently transfected with 5 µg of Flag-tagged DCAF11 wild-type or mutants in pNTM plasmid using TransIT-LT1 (Mirus MIR 2304). After an additional 1 day of incubation, cells were treated with MLN4924 (1 µM) for 1 h, then subsequently treated with M12 (10 µM) for 6 h. After the incubation period, cells were collected, washed with PBS, and lysed in Pierce IP lysis buffer (Thermo Scientific 87787) supplemented with cOmplete protease inhibitor cocktail. Cells were lysed for 30 min on ice, with vortexing every 10 min, then centrifuged for 10 min to remove the insoluble fraction. M12 was added to the wash buffer and lysis buffer of M12-treated samples. After being washed in IP lysis buffer, 25 µl of Anti-DYKDDDDK Magnetic Agarose (Thermo Scientific A36797) was added to each lysate sample. Samples were then incubated at 4 °C overnight on a rotator. Beads were washed three times with IP lysis buffer, and then boiled in 1× NuPage LDS sample buffer (Invitrogen NP0007). Immunoblotting was performed using the procedure described in the ‘Immunoblots’ section above.
Reporter cell line generation
Reporter constructs were transformed into Stbl3 Escherichia coli and purified using a MiniPrep Kit (Invitrogen K210011), and sequences were confirmed by Sanger sequencing (Quintara Biosciences). Lentiviruses for reporters were packaged into lentivirus as follows. First, 0.55 × 10⁶ HEK293T cells were seeded in 2 ml of DMEM medium. The next day, a packaging mix that includes 1.5 μg of psPAX2, 0.15 μg of pVSV-G and 1.5 μg of transgene plasmid was prepared in 37.5 µl of OptiMEM (Gibco 31985070). This mix was combined with 9 μl of TransIT-LT1 and 15 µl of OptiMEM, incubated for 30 min at room temperature and then applied dropwise to cells. Cells were allowed to incubate for another 48 h. Lentivirus was collected by 0.4-μm filters and then transduced to 1 × 10⁶ of HEK293T-Cas9 or K562-Cas9 cells at 10% volume ratio by spin infection. One day after infection, reporter cells were selected with puromycin at a concentration of 2 μg ml−1.
Reporter degradation assays
K562-Cas9 cells stably expressing DDX18 or BRD4 reporters were dosed with DMSO or degraders at various times and concentrations using D300e Digital Dispenser (HP). The fluorescent signal was quantified by flow cytometry (Symphony flow cytometer with BD FACSDiva 8.0 software, BD Biosciences, see Supplementary Fig. 2a for the gating strategy) and analysed using FlowJo v10 (flow cytometry analysis software, BD Biosciences). The geometric mean of the eGFP and mCherry fluorescent signal for round and mCherry-positive cells was calculated. GFP expression was normalized to mCherry signal, and drug treatments were compared to DMSO controls. The number of technical replicates is indicated in the figure legend. Data are shown from one representative experiment.
Genome-scale or UPS-targeted DDX18 reporter CRISPR screen
The genome-scale (Brunello sgRNA library; Addgene, #73178) or UPS-targeted CRISPR library (BISON sgRNA library; Addgene #169942) containing viruses were spin infected into K562-Cas9 cells expressing DDX18–eGFP stability reporter at a 10% volume ratio. Transduced cells were allowed to recover and expand for 7 days (Brunello) and 14 days (Bison) and then treated with DMSO or 10 µM M12 for 18 h. Top (stable gate) and bottom (unstable gate) 5% of cells by eGFP/mCherry fluorescence ratios were sorted for two replicates (see Supplementary Fig. 2b for the gating strategy). Sorted cells were pelleted and lysed, and sgRNAs were amplified, quantified by next-generation sequencing and analysed for enrichment in stable gate over unstable gate, representing degradation rescue. The resulting data was analysed as described previously48, using R (v4.5.1) and RStudio (v2025.05.1+513) with the following packages: tidyverse (v2.0.0), ggrepel (v0.9.8), GGally (v2.4.0), dr4pl (v2.0.0) and ShortReads (Bioconductor v3.2.4).
Single-gene knockouts
Guide RNAs targeting genes of interest were cloned into the sgBFP vector using BsmBI digestion/ligation as previously described48. Lentivirus was produced as described above. DDX18 stability reporter in K562-Cas9 cells were transduced with sgRNAs. The effect of the knockdown was determined by quantifying the GFP/mCherry ratios in BFP positive and negative populations by flow cytometry seven days after infection. Guid RNAs: sgDCAF11 #1, TGTGGGATCGACGCACCATG; sgDCAF11 #2, CGCCTAGATTGAGTCCCATG; sgDCAF11 #3, AGACGCTCCAGCCTACGTCG; and sgDCAF11 #4, AGAGGGTAAGTTACCTGCGG.
In vitro reconstitution of GSH-M12
A frozen aliquot (500 µl, 2.5 mg ml−1) of the complex DCAF11, DDB1(ΔBPB), DDA1 and DDX18 (residues 171–625), formed by 10 µM M12, were thawed, and an equal volume of acetonitrile (500 µl) was added to precipitate the proteins. The resulting opaque mixture was centrifuged at 15,000 rpm for 10 min at 4 °C. The supernatant was then analysed using UPLC–MS/MS (Waters) to obtain low-resolution (unit-mass) mass spectrometric data.
In vitro glutathionylation on M12 by GSH and GST
M12 (1 µM), GST (0.5 mg ml−1, purified in-house), and GSH (0.2 mg ml−1, reduced, Sigma G4251) were incubated in 100 µl buffer (50 mM Tris pH 8.0, 200 mM NaCl) at room temperature for 30 min, and an equal volume of acetonitrile was added to precipitate the proteins. The resulting opaque mixture was centrifuged at 15,000 rpm for 10 min at 4 °C. The supernatant was then analysed using UPLC–MS/MS (Waters) to obtain low-resolution (unit-mass) mass spectrometric data.
LC–MS/MS quantification of GSH-M12 in cell media and cell lysates
The concentrations of GSH-M12 in cell media and cell lysate samples were determined using a validated LC–MS/MS bioanalytical method. For sample preparation, a 50 µl aliquot of each sample was mixed with 50 µl of methanol/water (80:20, v/v). The mixture was vortexed for 10 min and centrifuged at 4,000 rpm for 10 min at 4 °C prior to LC–MS/MS injection. Calibration standards and quality control samples were prepared in the corresponding pooled DMSO-treated cell medium or lysate, respectively. The LC–MS/MS system consisted of a Shimadzu Nexera X2 UHPLC system coupled with a Sciex 5500 triple quadrupole mass spectrometer (ESI+). The optimized source parameters were as follows: ion source gas 1 (GS1), 55 psi; ion source gas 2 (GS2), 55 psi; curtain gas (CUR), 30 psi; collision gas (CAD), 9 psi; source temperature, 550 °C; and ion spray voltage, 4,000 V.
Chromatographic separation of GSH-M12 was achieved on a Supelco Ascentis Express C18 column (2.1 × 30 mm, 2.7 µm, 90 Å) using a gradient elution. Mobile phase A was 5 mM ammonium acetate in water with 1% (v/v) formic acid, and mobile phase B was 1 mM ammonium acetate in acetonitrile/water (95:5, v/v) with 0.025% formic acid. The liquid chromatography gradient (%B) was 1% (0.00–0.30 min), 1–95% (0.30–1.40 min), 95% (1.41–2.00 min), 95-1% (2.00–2.01 min) and 1% (2.01–2.40 min). The flow rate was 0.5 ml min−1. The column temperature was 40 °C and the injection volume was 5 µl. GSH-M12 was detected by the multiple reaction monitoring (MRM) transition at m/z 585.022 > 456.026. Under these conditions, the retention time of GSH-M12 was 1.35 min. The method was validated over a concentration range of 0.5 to 500 ng ml−1 for GSH-M12 in the cell medium or cell lysate.
Metabolite identification of M12 in cell lysates
Metabolites of M12 in cell lysates were analysed using a high-resolution mass spectrometer (HRMS). For sample preparation, a 50 µl aliquot of each sample was mixed with 50 µl methanol. The mixture was vortexed then centrifuged at 12,000 rpm for 10 min at 4 °C prior to LC–MS injection. The corresponding DMSO-treated cell lysate samples were used as negative controls. HRMS was performed using a Thermo Vanquish Horizon UHPLC system coupled with a Thermo LTQ Orbitrap Elite high-resolution mass spectrometer (ESI+). The source conditions were as follows: heat temp 375 °C, sheath gas flow rate 45, aux gas flow rate 10, sweep gas flow rate 3, I spray voltage 4.10 kV, capillary temperature 320 °C, S-lens RF level 55%. The LC–HRMS data was analysed using Mass-MetaSite software (Mass Analytica)
Chromatographic separation of M12 metabolites was achieved on a Waters Acquity UPLC BEH C18 column (1.8 µm, 2.1 mm × 100 mm). Mobile phase A was water containing 1% (v/v) formic acid, and mobile phase B was acetonitrile containing 1% (v/v) formic acid. The LC gradient (%B) was 5% (0–2 min), 5–75% (2–12 min), 75–95% (12–14 min), 95% (14–16 min), 95–5% (16–16.5 min), 5% (16.5–18 min). The column temperature was 40 °C and the flow rate was 0.5 ml min−1. The injection volume was 10 µl.
In vitro neddylation and ubiquitination assay
CUL4–RBX1 was neddylated as previously described, in brief, by incubating 12 µM CUL4–RBX1, 1 µM UBE2M, 0.2 µM APPBP1-UBA3, 25 µM NEDD8 at room temperature for 10 min in 25 mM HEPES, 100 mM NaCl, 10 mM MgCl2, 5 mM ATP, pH 7.5. The reaction was quenched by adding 20 mM DTT and was additionally purified by size-exclusion chromatography in 25 mM HEPES, 200 mM NaCl, 1 mM TCEP, pH 7.5. For ubiquitination of GFP–DDX18, 500 nM neddylated CUL4–RBX1 was incubated with 700 nM DCAF11–DDB1–DDA1 and 1 µM GFP–DDX18 with buffer, M12, or GSH-M12 on ice for 20 min. Reaction was performed in 25 mM HEPES, 100 mM NaCl, 10 mM MgCl2, 5 mM ATP, pH 7.5 with 2 µM UBE2D, 2 µM UBE2G1, 0.2 µM UBA1, and was initiated by adding 60 µM ubiquitin at room temperature. Samples were taken at indicated timepoints, quenched with SDS sample buffer, and separated by SDS–PAGE. Assay was analysed by detecting fluorescence of GFP–DDX18 on an Amersham Typhoon gel scanner.
Cryo-EM sample preparation and data processing
DCAF11, DDX18 (residues 171–625), DDB1(ΔBPB) (residue 1–395, 706–1140) and DDA1 were purified in the presence of 10 μM M12 compound and applied to a freshly glow discharged (20 mA for 2 min) Quantifoil UltraAuFoil grid (R0.6/1 and R1.2/1.3). The sample was blotted for 5 s (2 s for R1.2/1.3) after incubation for 10 s at 10 °C with a relative humidity of 90%, and after 3 s (0 s for R1.2/1.3) after blotting plunge frozen into liquid ethane using a Leica EM GP1 plunger (Leica Microsystems). Cryo-EM data were collected on a Titan Krios Electron microscope (Thermo Fisher) at 300 kV equipped with a Falcon 4i detector at the Harvard Cryo-Electron Microscopy Center for Structural Biology using both grids sequentially. Movie stacks were automatically collected using Thermo Scientific Smart EPU software. The dataset of both grids was combined. 10,632 movies were collected with a total dose of 52 e− Å−2 over 54 frames, at 0.73 Å per pixel with a nominal magnification of 165,000×, with a defocus range of −0.6 μm to −2.0 μm.
Electron microscopy data processing and model building
All processing was performed in cryoSPARC (v4.5.3 and 4.6.2)49. 10,632 movies were corrected for beam-induced motion, and contrast transfer function was estimated on the fly in cryoSPARC live. 6,549,850 particles were picked with template particle picking, followed by 2D classification. Several rounds of heterogenous refinement led to an initial consensus refinement from 191,769 particles at 2.52 Å, which was used as a seed model to classify 3,767,503 particles from TOPAZ particle picking (v0.2.5a), leading to a consensus refinement of 2.61 Å from 676,855 particles. Heterogeneous refinement and subsequent 3D classification were able to enrich for DDX18 density, leading to a 2.35 Å reconstruction from non-uniform refinement of 131,583 particles following reference-based motion correction, global contrast transfer function refinement, and local contrast transfer function refinement. Local refinement with a soft mask covering DDX18 further improved DDX18 density, yielding a 2.38 Å reconstruction. The two maps were combined into a final composite map using ChimeraX. All unsharpened and sharpened maps were used for model building with Coot (v0.9.8.92 EL)50.
Models for DDB1(ΔBPB) (PDB: 5FQD) and AlphaFold predictions for DCAF11 and the C-terminal lobe of DDX18 (residues 402–621) were rigid-body fitted into the density using ChimeraX (v1.8)51 and relaxed into the density using ISOLDE (v1.8)52. The GSH-M12 compound was built de novo and fit into the density between DCAF11 and DDX18. The model was iteratively refined in PHENIX (realspacerefine v1.21.2-5419)53,54 against the composite map and manually inspected in COOT. The non-uniform refinement, DDX18 local refinement, and composite map were deposited in the Electron Microscopy Data Bank under accession codes EMD-71834, EMD-71833 and EMD-71847, respectively. The DDX18–GSH-M12–DCAF11–DDB1(ΔBPB) model was deposited in the Protein Data Bank (PDB) under accession code 9PTU. Structural biology applications used in this project were compiled and configured by SBGrid55.
Chemical synthesis
Additional details are provided in the Supplementary Information.
Reporting summary
Further information on research design is available in the Nature Portfolio Reporting Summary linked to this article.

