


General ant husbandry and maintenance
Ooceraea biroi colonies of clonal line B81 were housed in 0.6-quart ClickClack boxes with an approximately 3-cm-deep plaster of Paris floor. Colonies were kept in a climate-controlled environmental room at around 25 °C and around 60% humidity, and the plaster floor was kept damp by regularly adding water. O. biroi colonies cycle between a reproductive phase during which colonies contain eggs and pupae and ants do not forage, and a foraging phase when larvae are present and ants forage for food27. An entire colony cycle takes around 5 weeks. Towards the end of the reproductive phase, eggs hatch into larvae. The foraging phase begins when larvae enter the third instar about 1 week later, coinciding with the emergence of the previous cohort of callow workers. During the foraging phase, which lasts around 2 weeks, colonies are composed entirely of workers and third and/or fourth instar larvae. In this phase, colonies were fed three times per week with frozen fire ant (Solenopsis invicta) brood. At the time of feeding, the plaster floor was briefly cleaned with Q-tips soaked in 10% bleach, and the plaster was then watered.
Ant maintenance for experiments
Naturally cycling O. biroi colonies contain several generations of adults. During the foraging phase, the youngest generation of ants are easily recognizable by their lightly melanized cuticle for up to 6–7 days after they eclose from pupae. For the primary and secondary neuropeptide screens, 300–500 6-to-7-day-old ants were separated from their colonies into new boxes together with larvae in an approximately 1:1 ratio and aged to 12 days old. At that time, they were tested in the screens. For all other experiments, we generated age-matched colonies of ants by seeding new colonies with 300–500 6-to-7-day-old ants and larvae in an approximately 1:1 ratio. At each subsequent foraging phase, the newly eclosed callow ants were removed and transferred into new colonies with larvae in an approximately 1:1 ratio. This procedure was repeated for every foraging phase in every colony. Ants in all resulting colonies were aged up to 5 months old. This resulted in a regular supply of age-matched ants that were 12 days old, and 1, 2, 3, 4 and 5 months old, as well as larvae for experiments. All ants and larvae used in experiments came from colonies in the foraging phase when the larvae were in the fourth instar, and 12–16 days after callow workers had eclosed. For one week before behavioural experiments, ant colonies were fed every other day with frozen S. invicta brood stained with 0.5% weight/volume bromophenol blue (Sigma Aldrich; B5525) in autoclaved reverse-osmosis (RO) water. This stain accumulates in the larval gut, increasing the visual contrast and thus facilitating automated tracking (see below). Ant colonies were last fed 24 h before behavioural experiments.
Neuropeptidome annotation
Lists of neuropeptide precursor protein sequences were compiled from literature focusing on insects31,32,33,34,35,36,82,83,84,85,86,87,88,89,90,91,92,93,94,95,96,97,98,99,100,101, as well as from a broad survey of neuropeptides across metazoan phyla23. We identified putative O. biroi neuropeptide precursor proteins by a BLASTp homology search of the compiled lists against the O. biroi non-redundant protein sequences (nr) database using default settings. Precursor proteins with high degrees of certainty were retrieved from additional insect species, with a focus on Hymenoptera. Homology of candidate O. biroi neuropeptide precursor proteins to query sequences was confirmed through reciprocal BLASTp on the nr database of the query sequence species. Signal peptides were identified using SignalP 6.0 (https://dtu.biolib.com/SignalP-6). Neuropeptides were annotated manually by identification of stereotypical proteolytic cleavage site motifs (RR, RK, KR and KK) and alignment to homologous neuropeptides from representative insect species (Supplementary Tables 1–3). Post-translational modifications were predicted by comparison with annotations of homologous insect neuropeptides in the UniProtKB database (https://www.uniprot.org). These annotations were performed in 2021 and reflect the neuropeptidome literature at that time.
Synthesis, storage and preparation of neuropeptides
Neuropeptides of 35 amino acids or fewer in size were synthesized including known modifications such as amidation and cyclization. For the neuropeptide screen treatment control, a 31-amino-acid neuropeptide, DH31, was synthesized with a biotin tag at the Proteomics Resource Center at Rockefeller University and provided lyophilized at 15% purity. Lyophilized DH31–biotin was resuspended in pure dimethyl sulfoxide (DMSO) to 30 mM concentration, aliquoted and stored at −80 °C before use. For the primary round of screening, neuropeptides were synthesized at the Proteomics Resource Center at Rockefeller University and provided lyophilized at 15–92% purity. We opted for this low level of purity of neuropeptides in the primary screen because of the large number of peptides and the costs associated with achieving high-purity preparations. This implies, however, that the rates of false positives in this screen might have been high, which we then mitigated by a stringent secondary screen using high-purity neuropeptides (see below). Lyophilized neuropeptides were stored for up to 4 months at −80 °C before resuspension. Stock solutions were made by resuspending lyophilized neuropeptides in pure DMSO to 2 mM–100 mM, depending on solubility, and then aliquoted and stored at −20 °C for up to 6 months before use. For the experiment to test whether the size range of our neuropeptide screening library could penetrate the cuticle, 30 mM DH31–biotin stock solution was diluted in autoclaved RO water to a final concentration of 1 mM DH31–biotin and 1% DMSO. The validation was then performed by soaking ants in biotinylated neuropeptides, dissecting out their brains and treating the brains with fluorescent-dye-conjugated streptavidin before performing quantitative confocal microscopy. For the primary neuropeptide screen, stock solutions of neuropeptides were diluted in autoclaved, RO-purified water to a final concentration of 1 mM neuropeptides and 1% DMSO. Control solutions were 1% DMSO in autoclaved RO water.
For the secondary round of dose–response analysis screening, neuropeptides were synthesized by Bio-Synthesis and provided lyophilized at higher than 95% purity. Stock solutions were made by resuspending lyophilized neuropeptides to a concentration of 10 mM in pure DMSO, and then aliquoted and stored at −20 °C for up to 4 months before use. For all experiments, fresh aliquots of stock solutions were diluted to avoid freeze–thaw cycles that compromise protein integrity. For the secondary screen, stock solutions were diluted to test concentrations of 0.1 mM, 0.3 mM, 1 mM and 3 mM neuropeptides in 1% DMSO and autoclaved RO water. For the repeat of the NPF dose–response experiment, stock solution of NPF was diluted to 0.003 mM, 0.01 mM, 0.03 mM, 0.1 mM, 0.3 mM, 1 mM and 3 mM NPF in 1% DMSO. Control solutions were 1% DMSO in autoclaved RO water.
Colony experiment
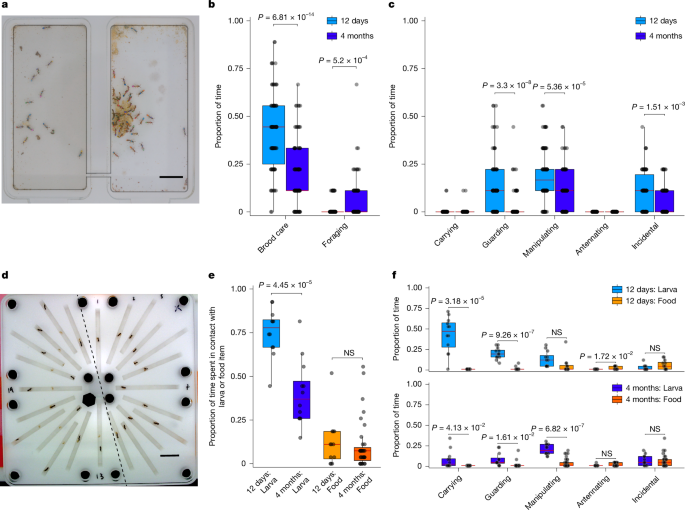
Colonies were housed in two-chamber arenas constructed from sandwiched layers of laser-cut acrylic and Tyvek cut to 100 × 100mm (length (L) × width (W)). From the bottom up, a base layer of 3-mm-thick acrylic was topped by a hollow, 6-mm-thick rim layer. The internal space of this layer was filled with plaster of Paris, which was kept moist. This was topped by a layer of water-vapour-permeable Tyvek that covered the plaster of Paris in one chamber but left it exposed in the other chamber. Because the ants prefer to nest on plaster of Paris, this partial Tyvek covering defines one chamber as the nest and the other chamber as the foraging arena. A layer of 3-mm-thick acrylic in which two rectangular 53 × 24mm (L × W) chambers were cut was placed on top of the Tyvek layer, forming the walls of the arena. The two chambers were connected by an entrance tunnel of 8 × 2mm (L × W). A final layer of 3-mm-thick clear acrylic was used to seal the arena, with a lid cut over each chamber so that they could be opened independently. Colonies of 60 ants (30 that were 12 days old; 30 that were 4 months old) and 60 larvae were transferred into these arenas after all ants were paint-marked with a unique two-dot colour code. Three such set-ups were constantly video-recorded at ten frames per second for 3 days. For each replicate, behaviour was scored manually in single frames subsampled every 8 h (nine frames). Frames either side of the focal frame were used to disambiguate behaviour in the focal frame. The following behaviours were scored: foraging (an ant is in the foraging arena when all larvae are in the nest) and physical contact with larvae. Physical contact with larvae was then subdivided into guarding (standing over a larva and stationary, with the caveat that this posture has not been functionally linked to aggressive responses towards threats); manipulating (mandibles and antennae in contact with larva and rapid movement of these body parts); antennating (antennal contact only, with antennae stretched forwards to contact the larva); carrying a larva; and incidental (not obviously tending a larva—either making contact as walking past or standing stationary in contact with the larva but oriented away from it).
Brood-care behaviour units, recording set-up and assay
For the neuropeptide screening and nutritional status behavioural experiments, the brood-care behavioural arenas were constructed from sandwiched layers of laser-cut acrylic and Tyvek cut to 10 × 10 cm (L × W) (Extended Data Fig. 1a). From the bottom up, a base layer of 3-mm-thick acrylic was topped by a hollow rim layer of 6-mm acrylic into which water-dampened cotton gauze was placed. This was then topped by a layer of 1.5-mm-thick acrylic mesh, followed by a layer of Tyvek that provided the floor of the assay chambers. A layer of 6-mm-thick acrylic in which 24 radially symmetrically arranged 30 × 2 mm (L × W) rectangles were cut was then placed on top of the Tyvek layer, forming the walls of the assay chambers. For the peptide injection and RNAi experiments, the hollow rim layer was filled with water-dampened plaster of Paris that replaced the cotton gauze, acrylic mesh and Tyvek layers and provided the chamber floor. These layers were secured by acrylic screws, and each unit was then secured by metal screws to a tray. At this point, larvae were loaded into the centre of each chamber, followed by treated ants. Each unit was then topped with a layer of clear, antistatic 3-mm-thick acrylic that formed the lid, secured to the units by screws. Between experiments, the lid and chamber layers were washed in hot water with antibacterial soap free of dyes and odorants, and the Tyvek or plaster floors were replaced. Each tray held 8 units of 24 assay chambers each. Trays were placed within a light-protected box containing 8 webcams (Logitech C910) positioned around 10 cm above the centre of each unit such that all 24 chambers per unit were within view for video recording. Lighting in the box was provided by white light-emitting diodes. Units were filmed at 5 frames per second and 2,592 × 1,944-pixel resolution for 5 h. The recording boxes were setup in a climate control room at around 25 °C and around 60% humidity.
Neuropeptide screening
In the screening assays, 12-day-old ants were removed from their colony using soft forceps and placed immediately into 1.5-ml Eppendorf tubes on ice, resulting in near instant anaesthesia. Solutions of neuropeptides were then added to the tubes. The tubes were briefly and vigorously shaken to completely submerge all ants in the solution and then placed back on ice for 20 min. The tubes of solution with ants were then poured onto dry paper towels, which pulled excess solution off the ants. Ants were then placed into the assay chambers for filming. In the primary screen, we tested each of 61 neuropeptides on n = 12 ants and compared their behaviour with that of n = 12 ants treated with control solution. The primary screen was designed to be high throughput and low stringency, with the goal of identifying a shortlist of candidates for a more rigorous secondary dose–response screen. Given that the neuropeptide solutions used in this screen were low quality (see ‘Synthesis, storage and preparation of neuropeptides’) and the statistical analyses were permissive, this approach is prone to produce many false negatives and false positives. In the secondary screen, the treatment method was the same as that used in the primary round, but each candidate neuropeptide was synthesized at high quality, tested on n = 24 ants per concentration and compared with n = 24 ants treated with control solution.
Extra behavioural control experiment
In separate control experiments, we compared the responses of adult ants to live O. biroi larvae, dead O. biroi larvae, dead O. biroi larvae washed in hexane, acrylic beads and fire ant (S. invicta) larvae (that is, prey items). For this experiment, a colony of about 500 6-to-7-day-old ants and larvae in an approximately 1:1 ratio was established and fed every other day with bromophenol-blue-stained S. invicta brood. When ants were 11 days old and larvae were in the fourth instar, two groups of around 100 larvae each were separated from the colony for treatments. One group of larvae was frozen overnight at −80 °C to kill them. These dead larvae were thawed at room temperature before the behavioural experiment. The larvae in the second group were placed in a glass scintillation vial and washed five times in pure hexane. These larvae were stored in hexane overnight at 4 °C and then dried on paper towels at room temperature for 20 min to allow residual hexane to evaporate before the behavioural experiment. Small (approximately 0.5-mm diameter), roughly cylindrical beads were laser cut from 3-mm pink acrylic. These beads were approximately the size of a late fourth instar O. biroi larva.
Behavioural tracking
Automated behavioural analyses of the single ant assays were performed using anTraX102, yielding (x, y) position co-ordinates for both the ant and the larva for each assay chamber. We wrote custom scripts that automatically calculated several measures used for analysis and tracking quality verification. These included an interaction score (1 if ant and larva positions aligned; 0 if not), the frame of larva detection (details below) and the percentage of frames in which the ant and larva identities were successfully classified. In 92% of chambers across all experiments, ant and larva identities were maintained in 99% or more of the video frames. We excluded data from chambers in which either the ant identity or the larva identity was maintained in 80% or less of the frames. However, this occurred rarely—in only 2.8% of chambers. In 5.2% of chambers, identities were maintained in 81–98% of frames. In these cases, most instances of identity and positional data loss occurred when an ant was carrying the larva and therefore occluding it from view. In these cases, the larva’s position data was manually corrected to match the ant’s position data over the frames from which the larva position was lost. Tracking data were visualized using Python with the packages numpy, pandas, scipy, matplotlib and seaborn. Scripts and example datasets for behavioural analyses and visualizations are available via GitHub (https://github.com/Social-Evolution-and-Behavior/Paul_Kay_Kronauer_2026).
Annotation and analysis of behavioural tracking data
To provide a broad overview of how ants interact with larvae in the one-on-one assay, we manually annotated behaviour on the basis of an evenly distributed subsample of 24 frames per individual for a total of 47 ants across 4 conditions: 12-day-old ant with an O. biroi larva (n = 12), 4-month-old ant with an O. biroi larva (n = 12), 12-day-old with an S. invicta larva (n = 12) and 4-month-old ant with an S. invicta larva (n = 11). Physical contact with larvae was scored for each frame and subdivided into guarding, manipulating, antennating, carrying and incidental, as for the colony assay. From the results of this manual scoring, physical contact with larvae emerged as a robust proxy for brood-care behaviour and therefore motivated and justified the subsequent use of an automated image-processing pipeline to extract physical contact data. Relevant behaviour begins when the ant first detects the larva, typified by antennal drumming on the larva and physical engagement with it (Supplementary Video 1). Larva detection was defined as the moment in frames when the (x, y) co-ordinates of the ant and larva first converge. Larva detection was confirmed by comparing the visualized data with the raw video for every ant, and errors were corrected manually. We defined the P1 behavioural phase as the period beginning with larva detection and continuing while the ant remains mostly in physical contact with the larva, irrespective of whether the ant is carrying the larva around the assay chamber or remaining in one location. Larva carrying did not consistently occur across all assays or conditions, and it was therefore collapsed into the P1 phase. The P2 phase was defined as the period when the ant begins to leave the larva and subsequently spends most of its time away from the larva. This phase continued until the end of the video recording. We determined the transition point between the P1 and P2 phases algorithmically for each ant. In brief, we first converted the ant and larva (x, y) positions into single values ranging between 0 mm and 30 mm (the length of the assay chamber). We saved these values as ‘PositionData’. Then, beginning from the frame of larva detection, we applied a 200-frame (40-s) sliding window over the ant’s PositionData, in which we calculated the difference between the ant’s absolute minimum and absolute maximum positions. We ignored the ant’s PositionData in frames in which the ant was physically interacting with or carrying the larva, to only capture PositionData from frames in which the ant was away from the larva. We saved these values as the ‘AntMaxDistance’. We then smoothed the AntMaxDistance data by applying a second 400-frame (80-s) sliding window in which we averaged the measures. We calculated the first inflection point of the smoothed AntMaxDistance data (that is, the frame at which the data first exceed half of the absolute maximum value of the data) and defined this frame as the transition point between the P1 and P2 behavioural phases. In rare cases (less than 1%) in which the transition point occurred at fewer than 1,000 frames from the moment of larva detection, we defined the transition point as 0 and the ant as having no P1 phase. These cases were excluded from the analysis of the P1 phase and phase transitions as outliers. In other rare cases (less than 5%), ants would carry the larva from the moment of larva detection to the end of the assay period. In these cases, the entire interaction period was defined as P1, the length of this period was taken as the P1 duration and, because there was no transition point and no P2 phase, we excluded these cases from analyses of the P2 phase. We then quantified the duration of the P1 phase (time from first detection of larva to the transition point) and the proportion of time that the ant was in physical contact with the larva in each of the P1 and P2 phases, as well as over the total assay period. Scripts and example datasets used for these analyses are available via GitHub (https://github.com/Social-Evolution-and-Behavior/Paul_Kay_Kronauer_2026).
Sample size and statistical analyses
We used power analyses to determine the sample size for all experiments. For the primary round of the neuropeptide screen, power analysis (parameters: 0.80 power, α = 0.05, two-sided comparison of means) showed that n = 12 ants per condition would give a power of 0.99, with an effect size based on estimates of mean and standard deviation from the average total proportion of time that young and old ants spent with larvae during the brood-care behaviour assay (Fig. 2g). We analysed the primary screen results with a t-test comparison of means, without correction for multiple comparisons or false discovery rate. Although this permissive statistical method increased false positives, it accommodated small effect sizes and optimized the sample size for throughput, allowing for a comprehensive test of the neuropeptidome. Effect sizes (Cohen’s d) of neuropeptide candidate behavioural measures (P1 duration, P1, P2 and total) were calculated as d = (meanneuropeptide − meancontrol)/(standard deviationcontrol).
In the secondary round of screening, power analysis (parameters: 0.80 power, α = 0.05, six groups, ANOVA) showed that a minimum of n = 12 ants per treatment would give a power of 1, with estimates of the F effect size taken from the time-course analysis of brood-care behaviour (Extended Data Fig. 1c–f). We used n = 24 ants per condition in the dose–response experiments of the secondary round of neuropeptide screening. For the experimental paradigms in which we compared mean NPF or AstA brain fluorescence measures, power analysis (parameters: power 0.80, α = 0.05, two-sided comparison of means) showed that a minimum of n = 5 brains per conditions would yield a power of 0.9, using estimates of mean and standard deviation from the AstA IHC aging analysis (Fig. 4c, AL measure). On the basis of these analyses, we used a minimum of n = 20 ants for all additional behavioural experiment paradigms (peptide injections, dsRNAi, siRNAi, fed or starved behaviour) and from these sampled a minimum of n = 5 brains or samples per condition for quantitative confocal microscopy and qPCR analyses, respectively. For all experiments, outliers were identified (ROUT method with Q = 1%) and removed before statistical testing. In some cases, data were normalized by square root transformation and statistical analyses were performed on the transformed data. Details on statistical analyses and the final sample sizes used for the data plotted in graphs are in the respective figure legends. Graphing and statistical analyses of data were performed using GraphPad Prism (versions 8–10).
Brain dissection and tissue preparation
Live ants were dipped in 95% ethanol for 5–10 s and then submerged in sterile filtered 1× phosphate-buffered saline (PBS) in a silicone-coated Petri dish under a dissection microscope. The antennae and mandibles were cut off using microdissection scissors, and the head cuticle was gently opened using forceps to reveal the brain. The brain was lifted from the ventral head cuticle, removing the oesophagus, which runs through the brain. Small tracheae on the surface of the brain were then gently removed. Brains were transferred into fixative (sterile filtered 1× PBS, 4% paraformaldehyde) using glass Pasteur pipettes that had been pre-lubricated with sterile filtered 1× PBS and 0.1% Tween. Brains for RNA FISH were fixed overnight at 4 °C. Brains for IHC were fixed for 2 h at room temperature. Fixative was removed with three quick washes followed by three 20-min washes in sterile filtered 1× PBS. Brains were either processed immediately for staining, or stored in sterile filtered 1× PBS, 0.02% sodium azide for up to 2 weeks at 4 °C.
RNA FISH staining
For RNA FISH staining of NPF and AstA, we obtained nucleic acid probes, fluorescently tagged hairpin amplifier sequences and buffers from Molecular Instruments. Brains were stained according to the Molecular Instruments HCR 3.0 Protocol. In brief, fixed brains were incubated in probe hybridization buffer for 30 min at 37 °C, and 8 pmol of NPF or AstA probes was added. The samples were incubated at 37 °C for 48 h rotating on a thermoblock at 300 rpm. Probes were removed with five 10-min washes of probe wash buffer, followed by two 5-min washes with sterile filtered 5× SSCT (5× sodium chloride citrate and 0.1% Tween-20). Samples were then switched into amplification buffer and incubated for more than 10 min at room temperature. Subsequently, 6 μl of 3 μM stock of each fluorescently tagged hairpin amplifier was prepared in separate tubes, heated to 95 °C for 90 s and then cooled to room temperature in the dark for 30 min. The appropriate hairpin sets for the probes were added to 100 μl of amplification buffer, transferred to the samples and incubated overnight in the dark at room temperature on a benchtop rocker. The next day, the amplification step was stopped by adding excess 5× SSCT, followed by five 10-min washes in 5× SSCT. The samples were then switched into sterile filtered 1× PBS through three quick washes, and brains were incubated in DAPI (1:500 of a 1 mg ml−1 stock solution) in sterile filtered 1× PBS for 10 min, followed by three 20-min washes in sterile filtered 1× PBS. Stained brains were mounted on silane coated glass slides (Electron Microscopy Sciences, 63411-02) in SlowFade Glass AntiFade mounting medium (Invitrogen, S36917).
Antibodies and IHC staining
For IHC staining of AstA, we used a polyclonal rabbit-anti-AstA antibody from Jena Biosciences (anti-A-AST, ADB-062). For IHC of NPF, we used a custom polyclonal chicken-anti-NPF antibody generated by YenZym through their Chicken Antibody Service with IgY extraction and purification. Chicken-anti-NPF was raised against the O. biroi NPF neuropeptide sequence (YLDLVREYYSMTGTARF-amide). The custom chicken-anti-NPF antibody is available upon request. We used secondary donkey-anti-rabbit and donkey-anti-chicken antibodies conjugated to either a488 or a594 fluorophores (Jackson ImmunoResearch, codes: 711-545-152, 703-545-155, 711-585-152 and 703-585-155). Antibody solutions were diluted 1:1 in pure glycerol and stored at −20 °C. For IHC staining, fixed brains were incubated in blocking solution (sterile filtered 1× PBS, 0.1% Triton X-100, 0.02% sodium azide, 5% donkey serum) for 1 h. Primary rabbit-anti-AstA at a final concentration of 1:1,000, or chicken-anti-NPF at a final concentration of 1:2,000, was then added, and brains were incubated for a further 7 days. Primary antibodies were then washed off in three quick washes followed by three 20-min washes in sterile filtered 1× PBS. Brains were again incubated in blocking solution for 1 h. Secondary antibodies were added at a final concentration of 1:500, and brains were incubated overnight. Secondary antibodies were washed off in three quick washes in sterile filtered 1× PBS, and brains were incubated in DAPI (1:500 of a 1 mg ml−1 stock solution) in sterile filtered 1× PBS for 10 min, followed by three 20-min washes in sterile filtered 1× PBS. All staining steps were performed at room temperature on a benchtop rocker. Stained brains were mounted on silane-coated glass slides in SlowFade Glass mounting medium.
Verification of antibody specificity
We used both antibody pre-adsorption experiments and dual RNA FISH + IHC staining experiments to verify the specificity of the AstA and NPF antibodies. The rabbit-anti-AstA antibody has been shown to bind to AstA neuropeptides that end in a terminal YXFGL-amide motif103. O. biroi AstA encodes five AstA neuropeptides, four of which end in a similar motif (AstA1–AstA4). Three of those are unique: AstA1 (YNFGL-amide), AstA2 (FSFGI-amide) and AstA4 (FSFGL-amide) (see Supplementary Table 3). For the AstA pre-adsorption control, rabbit-anti-AstA (1:2,000) was incubated with AstA1, AstA2 or AstA4 at a concentration of 1 mM in IHC blocking solution overnight at 4 °C. For the NPF pre-adsorption control, chicken-anti-NPF (1:1,000) was incubated with O. biroi NPF peptide at a concentration of 1 mM in IHC blocking solution overnight at 4 °C. Brains were then IHC stained with pre-adsorbed rabbit-anti-AstA solution or pre-adsorbed chicken-anti-NPF solution as the primary antibodies, or with non-pre-adsorbed rabbit-anti-AstA or non-pre-adsorbed chicken-anti-NPF as positive controls, respectively. All IHC staining steps for the pre-adsorption controls were performed as described above. For the dual RNA FISH + IHC experiments, brains were fixed and first processed for either AstA RNA FISH or NPF RNA FISH as described above, but at the last step brains were switched from 5× SSCT buffer into sterile filtered 1× PBS through three 20-min washes. Brains were then processed for AstA or NPF IHC staining, respectively, as described above.
Quantitative confocal microscopy
All brain samples within an experiment to be imaged for quantitative confocal microscopy were dissected, fixed and stained in parallel. Stained brains were mounted on silane-coated slides in SlowFade Glass mounting medium, and coverslips were sealed with clear nail polish. Slides of mounted brains were allowed to clear at room temperature inside a dark drawer overnight before imaging. All confocal images were acquired with a Zeiss LSM 900 confocal microscope using a Zeiss LD LCI Plan-Apochromat 40×/1.2-NA multi-immersion objective lens and glycerol immersion medium. Confocal z-stacks of whole brains were captured in a single image plane at 0.5 zoom and 1-μm optical steps at 4,084 × 4,084-pixel resolution using Airyscan multiplex fast settings in Zen software. Airyscan postprocessing of raw images was done using standard strength settings in Zeiss Zen Blue software. All brains within an experiment were imaged using the same settings for laser power, gain and offset, such that fluorescence measures were comparable across conditions.
Image analysis
Fluorescence was measured from confocal images using ImageJ. Both FISH and IHC staining of AstA had high signal-to-noise ratios, allowing thresholding to cleanly separate signal from background. To quantify regional differences in AstA FISH and IHC staining, ROIs were hand-drawn around the antennal lobes, protocerebrum (without mushroom bodies), SEZ, corpora allata and mushroom bodies. AstA signal was measured from every image slice in the z-stack. The total average fluorescence from each brain region was normalized by the total average fluorescence for the mushroom body (where AstA is not expressed) such that measurements were comparable between brains and across experimental conditions. Because NPF is expressed in only 16–20 cells per brain, we were able to hand-draw ROIs around the somas of every cell. The average NPF fluorescence was then measured from 3–12 image slices per cell for both FISH- and IHC-stained brains. NPF fluorescence measures were normalized to the total average brain fluorescence for each brain. Whole-brain NPF measures presented in the figures are the average of the normalized NPF fluorescence for the 16–20 cells per brain. Regional fluorescence measures for NPF are presented as averages of the normalized NPF fluorescence measures of subsets of cells within the antennal lobes, the adPC, the pdPC and the SEZ.
Annotation of NPF
While annotating NPF, we found two loci with near perfect identity in different positions on chromosome 1 (chr. 1) in the current O. biroi genome assembly and annotation available at the National Center for Biotechnology Information (NCBI) (assembly Obir_v5.4, annotation release 100). These were pro-neuropeptide Y-like (LOC113562173; chr. 1: 6,886,485–6,893,071) and uncharacterized (LOC105286742; chr. 1: 1,022,113–1,028,788). LOC113562173 occurs on the positive strand, whereas LOC105286742 occurs on the negative strand, such that the two loci are reverse complements. Aligning these two approximately 6.5-kb gene models revealed that they are 99.9% identical, except for a total of 26 bp of 1–2-bp gaps spread throughout the two loci. These observations suggested that NPF might have undergone gene duplication in O. biroi. However, several lines of evidence argue that this ‘duplication’ is, in fact, an error introduced during genome assembly, rather than a true duplication. First, BLAST alignment of either LOC113562173 cDNA or LOC105286742 cDNA to a haploid male genome assembly recovered only the same single hit on chr. 1 (assembly generated using short-read whole-genome sequences assembled with SOAP denovo104 from published samples: BioSample SAMN33870437 from BioProject PRJNA947942)28. Next, we PCR-amplified NPF exon 1 from both genomic DNA and a library of brain-derived cDNA, followed by Sanger sequencing (primer sequences are in Supplementary Table 5). The resulting sequences were identical to those of the haploid male genome assembly and differed from Obir_v5.4 LOC113562173 exon 1 at the single 2-bp gap, showing no evidence of the ‘duplicated’ LOC105286742 in the Sanger sequence traces. However, attempts to amplify the entire (5′-untranslated region (UTR) to 3′-UTR) LOC113562173 from genomic DNA (gDNA) or to clone the NPF cDNA using primers based on LOC113562173 or LOC105286742 failed. Furthermore, alignment of gDNA and brain-derived RNA-sequencing reads to Obir_v5.4 revealed islands of coverage peppered with areas of zero coverage in both LOC113562173 and LOC105286742. Together, these observations suggest that there is only one NPF gene in O. biroi, that the duplicated loci in assembly Obir_v5.4 are due to assembly errors and that the NPF gene model might be partially incorrect.
To manually annotate the NPF gene model, we used several independent approaches. First, we aligned the NPF exon 1 sequence to a recently published diploid female genome assembled from high coverage PacBio long read sequences, Obir_v5.6 (ref. 105). Because this reference sequence was assembled using a diploid-aware assembler, it should be less prone to introducing false duplications into a haploid genome sequence. As expected, this revealed a single locus on chr. 1. Next, we generated candidate NPF transcripts by de-novo-assembling a published dataset of brain-derived RNA sequences (BioProject: PRJNA304722)106 using Trinity v.2.14.0 (ref. 107). We identified two candidate NPF transcripts, both of which aligned to the same location as NPF exon 1 on chr. 1 of Obir_v5.6. Finally, we aligned an independent set of brain-derived RNA-sequencing reads to Obir_v5.6 to add coverage data to support our annotation of the gene model. Together, these analyses revealed a 6,254-bp locus including 5′-UTR, two exons and 3′-UTR at position chr. 1: 5,408,614–5,414,868 in Obri_v5.6. Aligning Obir_v5.6 NPF to LOC113562173 revealed that the coding sequence, including the part encoding the NPF neuropeptide, is nearly identical, except for the 2-bp gap in exon 1 described above. However, the two versions have different sequences in the 5′-UTR beginning 88 bp upstream of the translational start site, explaining our failed attempts to clone the NPF cDNA using primers within the incorrect 5′-UTR sequence of LOC113562173. However, we successfully cloned the NPF cDNA using primers based on the Obir_v5.6 NPF sequence as described below (Supplementary Table 5). We expect that future NCBI reference assemblies and annotations for O. biroi will resolve the assembly errors and artificial duplication of the NPF locus in Obir_v5.4. However, given that the NPF coding sequence is mostly identical and that the NPF neuropeptide sequence is correct in both assemblies, we report the NPF locus as pro-neuropeptide Y-like (LOC113562173) as found in the currently available NCBI reference genome. On the basis of our analyses, the correct NPF cDNA sequence (Obir_v5.6) with which we designed our RNA FISH probes and antibody, is given below. The translation of this NPF cDNA, which highlights the NPF neuropeptide sequence, is reported in Supplementary Table 2.
>NPF cDNA (Obir_v5.6) 696 bp:
5′_GATCCGAACTACTGAAACGTTCGCCGGTACGTCAGGAAGATATACCAGAAAGCTGCCGACAGGTGAGGAAGAAATCGTCTATCAGACGGACTCGGATTGCTCTTAAGCCGATCTTCCCCCTTATTCGCGGTTTGCCATTCGATCTACGATCCGATCGTCAGGGAGATTTAATCCAACCGAGACTGCTACCTCAAGCCGTTCAAAATGCGGACAGAGATGAGTGCAGCTCGTTTTCTTTGTTGCTTACTGTTGATCGCCATTGTGGGAACTGTCATCGCATGTGCCGAGCCGGAATCCATGGCTAGATCGACGAGACCAAAAGTAATTGCTAATTCCGAAGAATTGAAGCGATATCTCGATCTTGTTCGAGAGTATTATTCCATGACAGGAACAGCAAGGTTTGGAAAGCGAAATGATCCACCAATCTCGGAGAATACTATTTGGGAAATATTTAGGATGATCCTGGACAATGCACAACGGCAAAATGAACAGCGAAGACGGGATAGGATCAGACAGAACAAAGAGCCAGTCCCGTTTAATGACTTCTAGAGTTTGGATGCTGACAAGTACACGTCGCTACACGACCTGGCTCTCATCCGAATGTAATTGACAAATACTTGGACAATGTACAATAAATTTCATAGCGTTTTCCCTTTTACTCTCCCTAATTTCCATTGAAATATATCAAAGATGTTA_3′.
Cloning of NPF, AstA and GFP cDNAs
To clone NPF and AstA cDNAs, we prepared a general library of cDNAs from total RNA extracted from a sample of 100 pooled ant heads. In brief, heads were removed from live ants and placed in cold TRIzol reagent on ice and then flash-frozen on dry ice. The sample was homogenized using a QIAGEN TissueLyser II, centrifuged and transferred to a PhaseLock column (5PRIME) to extract the RNA. RNA was then purified using the QIAGEN RNeasy Mini Kit according to the manufacturer’s protocol, including on-column DNase treatment. RNA quality and concentration were assessed using a Bioanalyzer (Agilent). The extracted RNA was of high quality, with an RNA integrity number (RIN) higher than 8.0. cDNAs were then generated using the Superscript IV First Strand Synthesis System Kit (Invitrogen; 18091050) with oligo-dT primers. We designed primers tagged with T7 RNA polymerase transcription start sites for NPF, AstA and GFP (Supplementary Table 5). T7-NPF and T7-AstA cDNAs were PCR-amplified from the 100-head cDNA sample. T7-GFP was PCR-amplified from an NdeI-linearized plasmid containing a D. melanogaster codon-optimized eGFP gene (plasmid plM153; gift from R. Coleman). T7-NPF, T7-AstA and T7-GFP were then cloned into the pCR4-TOPO TA vector using the TOPO TA Cloning Kit for Sequencing according to the manufacturer’s protocol (Invitrogen, K457501). The resulting vectors (pCR4-T7-NPF, pCR4-T7-AstA and pCR4-T7-GFP) were transformed into competent Escherichia coli cells that were then streaked on penicillin BACTO Agar plates (BD, 214010) and incubated at 37 °C overnight. Colonies were selected and plasmid DNA was extracted using the QIAGEN Plasmid Mini Kit according to the manufacturer’s protocol (QIAGEN, 12123). Positive clones were identified by EcoRI restriction enzyme digest of plasmid DNA and gel electrophoresis analysis. Sequences were then confirmed by Sanger sequencing (GENEWIZ).
Generation of long double-stranded RNAs for dsRNAi experiments
Long double-stranded NPF, AstA and GFP RNAs (dsRNAs) were generated using the MEGAscript RNAi Kit (Invitrogen, AM1626) according to the manufacturer’s protocol (Supplementary Table 6). In brief, we PCR-amplified T7-NPF, T7-AstA and T7-GFP from their respective pCR4-TOPO TA vectors and used 1 μg of each of these products as the template in a 4-h in vitro transcription reaction to generate dsRNA. The resulting dsRNA samples were then nuclease-digested with DNase and RNase to remove the T7-PCR templates and single-stranded RNAs. The samples were column-purified and eluted with two 50-μl doses of elution buffer preheated to 95 °C. The resulting dsRNAs were then precipitated by incubating with 3 volumes of ice-cold ethanol and 0.1 volumes of 3 M sodium acetate at −80 °C overnight. The samples were centrifuged, and the dsRNA pellets were washed three times in ice-cold ethanol, then dried at room temperature and resuspended to 10 μg μl−1 concentration in sterile filtered RNA Duplex Buffer (1× RDB: 30 mM HEPES and 100 mM potassium acetate, pH 7.5). The samples were then aliquoted and stored at −80 °C before use. Fresh aliquots of NPF, AstA and GFP dsRNAs were used for each experiment.
Head injection protocol
Ants were anaesthetized on ice and then secured on their side on a small dab of adhesive removable poster putty (Duck Brand) under a dissection microscope, such that the lateral aspect of the head was in view. Forceps and a 25G syringe needle point (BD PrecisionGlide Needle; 305122) were used to gently open a small hole (less than 0.3 mm in diameter) in the cuticle on the lateral aspect of the ant head. Injection solutions were loaded into a quartz glass micropipette (Sutter Instrument; Q114-53-10NP) pulled needle connected to either a Nanoject-II microinjector (Drummond Scientific) or a FemtoJet 4i microinjector (Eppendorf) and mounted on a four-axis micromanipulator. Using the micromanipulator controls, the micropipette needle was gently inserted into the hole at an angle of around 30° to minimal depth to avoid damaging exposed mandible muscles that laterally surround the brain. Then, 10–14 nl of injection solutions were injected using slow speed on the Nanoject-II, or 300-hPa injection pressure (pi) and 0-hPa compensation pressure (pc) on the FemtoJet 4i. When using the FemtoJet 4i, the time to inject the desired volume was calibrated for each needle by continuously dispensing fluid from the needle for 30–90 s onto parafilm, then measuring the volume of the resulting drop of fluid (typically around 1 μl). After the injection, the needle was carefully pulled away from the head and ants were gently removed from the adhesive putty and placed into a Petri dish filled with water-dampened plaster of Paris. Ants were allowed to recover for a minimum of 2 h in the climate control room before subsequent experiments.
dsRNAi injection experiments
dsRNAi injection solutions were prepared by mixing fresh aliquots of NPF, AstA or GFP dsRNAs in 1× RDB with sterile filtered artificial haemolymph (1× AHL: 103 mM NaCl, 3 mM KCl, 26 mM NaHCO3, 1 mM NaH2PO4, 8 mM trehalose dihydrate, 10 mM dextrose, 5 mM TES, 4 mM MgCl2 and 1.5 mM CaCl2; pH 7.3) and rhodamine B (Thermo Fisher Scientific; 296570100) to aid visual confirmation of injection. The components were mixed to final concentrations of 1 ng nl−1 dsRNA, 0.8× RDB, 0.2× AHL and 20 μM rhodamine B. Live, anaesthetized ants were injected with 13.2 nl of injection solutions into the lateral aspect of the head as described above. The ants were then grouped into colonies according to treatment condition together with fourth instar larvae in a 1:1 workers-to-larvae ratio. These colonies were fed and allowed to recover overnight. Then, at 24, 48 and 72 h after injection the surviving ants were tested in the brood-care behaviour assay. After the first two behavioural tests, the ants were returned to their colonies and fed again. In the AstA dsRNAi experiment, 66% of AstA dsRNAi and 75% of GFP dsRNAi ants were still alive at 72 h after injection. In the NPF dsRNAi experiment, 66% of NPF dsRNAi and 83% of GFP dsRNAi ants were alive at 72 h after injection. After the third behavioural test, we immediately dissected the brains from the ants and processed them for RNA FISH staining to measure NPF or AstA expression using quantitative confocal microscopy.
siRNAi injection experiments and qPCR
We designed 27mer Dicer-substrate siRNAis targeting the coding sequences of NPF, AstA and eGFP (Supplementary Table 6) using the RNAi Design Tool provided by Integrated DNA Technologies (IDT). We resuspended the siRNAis in 1× RDB to 100 μM stock concentration and stored them at −20 °C before use. Injection solutions were prepared by mixing siRNAis with sterile filtered AHL and rhodamine B to final concentrations of 50 μM siRNAi, 0.5× RBD, 0.5× AHL and 10 μM rhodamine B. Live, anaesthetized ants were injected with 13.2 nl of injection solutions into the lateral aspect of the head as described above. The ants were then grouped into colonies according to treatment condition and grouped with fourth instar larvae in a 1:1 ratio. These colonies were allowed to recover for 72 h, during which they were fed daily. At 72 h after injection, we tested the surviving ants in the brood-care behaviour assay. In the AstA siRNAi experiment, 91% of AstA siRNAi and 86% of GFP siRNAi ants were alive at 72 h after injection. In the NPF siRNAi experiment, 83% of NPF siRNAi and 63% of GFP siRNAi ants were alive at 72 h after injection. Immediately after the behavioural assay, we removed the ant heads and processed them for qPCR to measure NPF and AstA expression. In brief, for each sample, heads were removed from two to four live ants, pooled, placed into cold TRIzol reagent on ice and flash-frozen on dry ice. For each of the siRNAi experiments, nine samples per treatment condition of control GFP siRNAi and either AstA siRNAi or NPF siRNAi were collected. The samples of ant heads in TRIzol were then homogenized using a QIAGEN TissueLyser II, centrifuged and transferred to PhaseLock columns (5PRIME) to extract the RNA. RNA was extracted and purified using the QIAGEN RNeasy Mini Kit according to the manufacturer’s protocol, including on-column DNase treatment. RNA quality and concentration were assessed using a Bioanalyzer (Agilent). RNA from all experiments was of high quality, with RIN > 8.0. cDNA was then generated using the SuperScript IV VILO Master Mix Kit with oligo-dT primers (Thermo Fisher Scientific; 11756050) and 30 ng RNA input per sample. Negative (no reverse transcriptase; RT−) controls for the cDNA generation were also made. qPCR primers specific to AstA, NPF and GAPDH were designed using NCBI Primer-BLAST to cross exon–exon junctions and with otherwise default settings. qPCR reactions were run using Applied Biosystems SYBR Green PCR Master Mix (Thermo Fisher Scientific, 4309155) with a 10-μl reaction volume on an Applied Biosystems QuantStudio3 thermocycler. We validated that the AstA, NPF and GAPDH primers (Supplementary Table 5) had higher than 90% efficiency using five tenfold serial dilutions of control cDNAs to generate standard curves before experiments. For the qPCR experiments, all samples were run in three technical replicates, including no-template and RT− controls. Average CT values were calculated from the technical replicates with automatic outlier removal provided in the QuantStudio3 software. Expression was then analysed using the −ΔΔCT method108.
Peptide injection experiments
NPF and AstA2 were synthesized by Bio-Synthesis to higher than 95% purity and were provided lyophilized. Lyophilized NPF and AstA were stored at −80 °C for up to 2 months before resuspension. Immediately before experiments, the lyophilized peptides were resuspended in pure DMSO to a stock concentration of 10 mM. Peptide injection solutions were prepared by mixing stock solutions of NPF and AstA peptides with 1× AHL and rhodamine B to aid in visual confirmation of injection. These components were mixed to final concentrations of 50 μM NPF or AstA peptide, 1× AHL, 10 μM rhodamine B and 0.1% DMSO. Control solutions were 1× AHL, 10 μM rhodamine B and 0.1% DMSO. Live, anaesthetized ants were then injected with 10 nl of injection solution into the lateral aspect of the head as described above. The ants were grouped into colonies according to treatment condition and allowed to recover for 2 h in the climate control room. In the NPF peptide injection experiment, all ants survived. In the AstA2 peptide injection experiment, 90% of AstA2-treated and 86% of control-treated ants survived. The surviving ants were then tested in the brood-care behaviour assay.
Nutritional status modulation experiment
We prepared ants and larvae for this experiment from a naturally cycling colony in the foraging phase. We counted the day that the newest generation of young ants eclosed from pupae as day 0. We fed the colony on days 0 and 2 with S. invicta brood stained with bromophenol blue. Then, on day 4, two small colonies of 50 four-day-old ants with 50 larvae were separated into two 30-mm-diameter Petri dishes filled with a layer of moist plaster of Paris. One colony was fed four more times over the next 8 days (on days 5, 7, 9 and 11), whereas the other colony was starved during these 8 days. At the end of this period, all ants were 12 days old. We tracked larval survival and found that 48 out of 50 larvae and 49 out of 50 larvae survived in the fed and in the starved colony, respectively. All ants in both fed and starved conditions survived to 12 days of age. The 12-day-old fed and starved ants were then tested in the brood-care behaviour assay. Immediately after the behaviour assay, their brains were dissected and processed for RNA FISH staining to measure NPF and AstA expression using quantitative confocal microscopy as described above.
Reporting summary
Further information on research design is available in the Nature Portfolio Reporting Summary linked to this article.

