


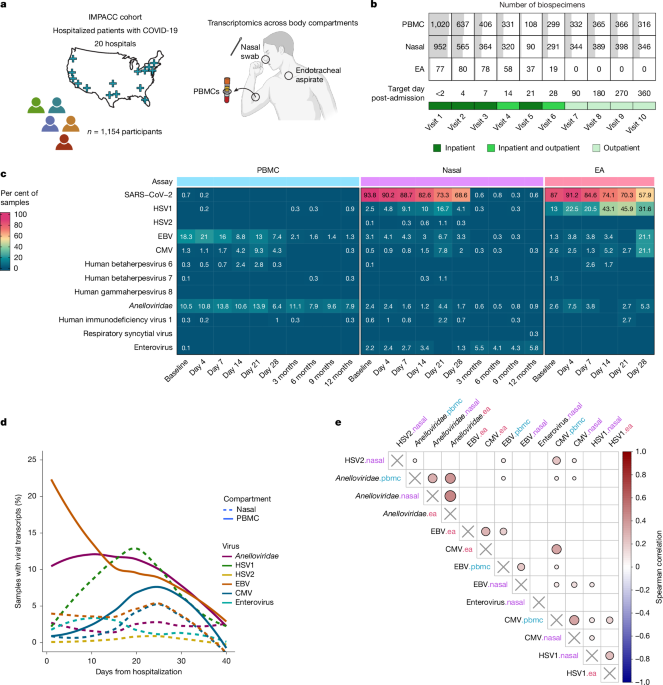
Study design and participant recruitment
IMPACC is a prospective longitudinal study that enrolled >1,000 hospitalized patients with COVID-19, as previously described27,32,55,56,57,58. Participants 18 years and older were recruited from 20 hospitals across 15 academic institutes within the USA (Fig. 1a). All participants were confirmed to be SARS-CoV-2-positive by reverse transcription PCR (RT–PCR) testing and no participants were vaccinated for SARS-CoV-2 at time of enrolment. Nasal swabs, blood, and endotracheal aspirate (for ventilated patients) were collected within 72 h of hospital admission (visit 1) and on days 4, 7, 14, 21 and 28 post-hospital admission in addition to convalescent samples at 3, 6, 9 and 12 months. Additionally, nasal swabs, blood and endotracheal aspirate were also collected (when possible) within 24 h and 96 h of escalation to intensive care unit-level care or when a participant was readmitted to the hospital >48 h after discharge. In the IMPACC dataset, these samples were indicated as ‘escalation visits’, and in this Article, the escalation visit samples were only used for the longitudinal GAMM and the CyTOF cellular association analyses to minimize effects of more frequent sampling for critically ill participants. Participants were characterized into one of five trajectory groups based on latent class mixed modelling of a seven-point ordinal scale that characterized degree of respiratory illness and reflected acute COVID-19 severity24. Similarly, participants were clustered into 4 PRO groups from latent class mixed modelling trajectories of convalescent survey responses collected at 3, 6, 9 and 12 months32. The modelling used participant responses from the EQ-5D-5L59, health recovery score (visual analogue scale of 1–100 to indicate overall physical and mental function compared to pre-COVID function), and the following PROMIS forms (https://commonfund.nih.gov/promis): PROMIS Item Bank v2.0—Physical Function, PROMIS Item Bank v2.0—Cognitive Function60, PROMIS Scale v1.2—Global Health Mental 2a61, PROMIS Item Bank v1.0—Psychosocial Illness Impact-Positive—Short Form 8a61, and PROMIS Pool v1.0—Dyspnea Time Extension62. All PROMIS measures were scored and standardized following PROMIS standardized instructions. Clinical characteristics and demographics for the entire cohort are reported in Supplementary Table 1.
Ethics statement
The Department of Health and Human Services Office for Human Research Protections (OHRP) and the National Institute of Allergy and Infectious Diseases (NIAID) concurred that the IMPACC study qualified for public health surveillance exemption. The study protocol was sent for review to each site’s institutional review board (IRB), with twelve sites conducting as a public health surveillance study, and three sites integrating the IMPACC study into IRB-approved protocols (The University of Texas at Austin, IRB 2020-04-0117; University of California San Francisco, IRB 20-30497; Case Western Reserve University, IRB STUDY20200573) with participants providing informed consent. Participants enrolled at sites operating as a public health surveillance study were provided information sheets describing the study including the samples to be collected and plans for analysis and data de-identification. Participants who requested not to participate after review of the study plan and information were not enrolled. Participants were not compensated while hospitalized but were subsequently compensated for outpatient visits and surveys. This study was registered at clinicaltrials.gov (NCT04378777) and followed the strengthening the reporting of observational studies in epidemiology (STROBE) guidelines (Extended Data Fig. 1a).
Sample processing and assays
Samples were processed as previously described27,32,55,56,57,58, with the sample protocol extensively documented in the IMPACC study design and protocol paper55. In brief, 10 ml of blood and nasal swabs were collected at each visit, with blood processed within 6 h of collection. Blood was collected in both a 2.5 ml Greiner Vacuette CAT Serum Separating Tube (SST) (454243P) for serum and a 7.5 ml Sarstedt Venous blood collection monovette EDTA (NC9453456) for whole blood, PBMCs and plasma. The SST was kept vertical at room temperature for at least 30 min before centrifuging at room temperature for 10 min at 1,000g. Serum was then aliquoted at 100 μl for downstream assays.
From the EDTA tube, it was briefly inverted to mix before aliquoting 270 μl of whole blood for CyTOF. The 270 μl CyTOF aliquot was added directly to the Maxpar Direct Immune Profiling Assay tube (MDIPA antibodies listed in Supplementary Table 9) and incubated for 30 min at room temperature. After incubation, 410 μl of Smart Tube Prot1 Stabilizer (SmartTube) was added with a 10 min incubation at room temperature before storage at –80 °C until shipment to the respective processing core. The remaining blood was centrifuged at room temperature for 10 min at 1,000g before aliquoting and storing 500 μl of plasma at –80 °C for proteomic and metabolomics. PBMCs were then isolated from the remaining sample using the SepMate and Lymphoprep system (StemCell) following manufacturer protocol and as previously described55. PBMCs were then stored at 2.5 × 10⁵ cells in 200 μl of RLT Buffer (Qiagen) and β-mercaptoethanol at –80 °C.
Interior nasal turbinate swabs (herein referred to as nasal swabs) were collected and stored in 1 ml of Zymo-DNA/RNA shield reagent (Zymo Research), before RNA was extracted twice in parallel from 250 μl of sample and purified with the KingFisher Flex sample purification system (ThermoFisher) and the quick DNA-RNA MagBead kit (Zymo Research). The duplicated RNA was pooled and aliquoted at 20 μl for the downstream assays (SARS-CoV-2 RT–qPCR and RNA-seq).
When participants were ventilated, an endotracheal aspirate was also collected in a 40 cm3 Argyle specimen trap and was processed within 2 h of collection. First, 500 μl of 1:1 diluted endotracheal aspirate with Maxpar PBS (Ca2+ and Mg2+ free) was mixed with 500 μl of DNA/RNA shield in a Zymo tube with lysis beads and subsequently stored at –80 °C for bulk RNA-seq.
Collected samples were then shipped and processed for nasal, PBMC, and endotracheal aspirate RNA-seq, plasma proteomics, serum cytokine PEA, serum EBV and CMV antibody titres, whole-blood CyTOF, and plasma metabolomics at their respective processing cores as previously described27,32,55,56,57,58. Each assay is described in brief below with additional technical details in the prior publications27,32,55,56,57,58, and a list of analytes evaluated from the PBMC RNA-seq, nasal RNA-seq, serum cytokines and chemokines, and plasma metabolomics assays is reported in Supplementary Table 8.
Nasal, endotracheal aspirate and PBMC RNA-seq
Nasal transcriptomics data were processed using a workflow managed on the Galaxy platform. RNA extracted from the nasal swabs was DNase-treated and depleted of human ribosomal RNA before amplification with random hexamers (Ribo-Zero Plus kit), except for the convalescent samples (3, 6, 9 and 12 months) which instead used poly-A amplification for library prep (SMART-seq V4). Before sequencing, libraries were quantified on both a Quant-it dsDNA High Sensitivity Assay and Fragment Analyzer (Advaced Analytical; kit ID DNF474), with samples containing adapter dimers as more than 4% of electropherogram area failed before sequencing. Technical controls (K562, Thermo Fisher Scientific, AM7832) were compared across batches to ensure minimal batch variability. Libraries were normalized to 10 nM before base calls were generated on the NovaSeq6000 instrument (RTA v3.1.5) at 100 bp paired-end read length, and demultiplexed unaligned BAM files were produced using Picard’s ExtractIlluminaBarcodes and IlluminaBasecallsToSam tools (https://broadinstitute.github.io/picard/). These BAM files were converted to FASTQ format using Samtools bam2fq (v1.4)63. Adapter trimming and quality filtering were performed using Trimmomatic (v0.36.5)64, with reads trimmed by one base at the 3′ end and further trimmed from both ends to ensure a minimum base quality score of Q30. Adapter sequences were also removed. Trimmed reads were aligned to the GRCh38 human reference genome65 using STAR (v2.4.2a)66 with gene annotations from Ensembl release 91 (ref. 67). Gene-level counts were generated using HTSeq-count (v0.4.1)68. Quality control metrics were compiled using Picard (v1.134), FASTQC (v0.11.3) (https://www.bioinformatics.babraham.ac.uk/projects/fastqc/), and Samtools (v1.2). Samples with poor quality (defined as median coefficient of variation (CV) in gene coverage >0.8 or aligned counts <1 million) were excluded from downstream analysis.
RNA extracted from endotracheal aspirate specimens was DNase-treated and depleted of human ribosomal RNA. Complementary DNA (cDNA) was synthesized using random hexamers to capture both coding and noncoding transcripts. Libraries were sequenced with 100 bp paired-end reads on the NovaSeq6000 instrument with NovaSeq S4 flow cells (200 cycles) targeting 50 million reads per sample. Human reads were aligned to the GRCh38 reference genome65 and quality-controlled. Raw counts were normalized across libraries using the TMM method implemented in the edgeR package69. To control for batch effects, participant and control samples were co-sequenced within each batch.
For the PBMC transcriptomics, RNA was extracted from the 2.5 × 10⁵ cells stored in RLT Buffer (Qiagen) using the Quick-RNA MagBead Kit (Zymo) with DNase digest. RNA quality was then evaluated with both a Quibit HS RNA assay and Fragment Analyzer (Agilent) before cDNA was prepared with the SMART-Seq v4 Ultra Low Input RNA Kit (Takara Bio) from an input of 10 ng of RNA. After a bead-based clean-up, the Nextera XT DNA Library Preparation kit (Illumina) was used to prepare the sequencing libraries which were validated by capillary electrophoresis with a Fragment Analyzer (Agilent). The resulting libraries were pooled at equimolar concentrations and sequenced on an Illumina NovaSeq6000 at 100 bp paired-end read length with a target of 25 million reads per sample. Adapter trimming and quality filtering were performed using Cutadapt (v1.14). Reads were aligned using STAR (v2.4.2a) to a composite reference genome that included the human genome (GRCh38, Ensembl release 91)65 and SARS-CoV-2 (NCBI strain MN908947.3)70. Gene counts were computed using HTSeq-count internally within the STAR alignment step. Quality control metrics were assessed using FASTQC (v0.11.5), Picard tools (v2.22), and STAR log outputs. QC metrics included average base quality per read (>Q30), per cent and absolute counts of reads uniquely mapped to annotated transcripts, and other alignment-based quality statistics.
Taxonomic alignments for human-infecting viruses from the PBMC, nasal and endotracheal aspirate RNA-seq data were obtained from CZID71, which removes host reads before aligning remaining reads against the National Center for Biotechnology Information (NCBI) nucleotide and non-redundant databases. A sample was considered positive for a virus if it had at least one read that mapped to both the nucleotide and non-redundant database. At least one water control was included on each plate/batch from all transcriptomics, with no water control samples having detectible reads for the human-infecting viruses evaluated in this Article, supporting the low threshold for positivity. When evaluating for potential batch effects of viruses, we identified one plate from the nasal transcriptomics that had an above average rate of HSV1 positivity (>60% compared to the average batch approximately 10%), which may have been due to cross-contamination from a sample in the batch with an extremely high HSV1 viral load (about 250,000 RPM). As a result, we excluded this one plate from contributing to identifying HSV1 positivity and from all host transcriptomic analyses. Additionally, some samples were sequenced multiple times across batches, in the case of a sample sequenced multiple times, the mean RPM of each virus across the samples was used for that participant event.
In addition to the IMPACC PBMC RNA-seq, RNA-seq data were retrieved from the Mount Sinai COVID-19 Biobank (syn35874390)25,26. The retrieved raw fastq were processed as outlined above through CZID to identify reads belonging to human-infecting viruses.
Nasal SARS-CoV-2 RT–qPCR
SARS-CoV-2 viral load was assessed from nasal swab samples using RT–qPCR targeting the N1 and N2 regions of the nucleocapsid gene, following the CDC protocol (https://www.cdc.gov/flu/php/laboratories/influenza-sars-cov-2-multiplex-assay.html). Reactions were performed using Quantabio One-Step RT–qPCR ToughMix on a QuantStudio 5 instrument. Cycle threshold (Ct) values for N1 and N2 were used as the primary readout.
Whole-blood CyTOF
Whole-blood CyTOF prepared samples were thawed according to the SmartTube Prot1 Thaw/Erythocyte lysis protocol before samples were barcoded with the Fluidigm Cell-ID 20-Plex Palladium Barcoding Kit. After barcoding, samples were pooled and additional surface antibody staining was performed (antibodies listed in Supplementary Table 9) at a final concentration of 1 µl antibody per 10 million cells in a volume scaled to cell number (100 µl for every 10 million cells), with a 30 min incubation on ice. After surface staining, samples were washed twice (each 1 ml of CyFACS (1× PBS + 0.2% BSA + 0.05% NaN3) at 800g × 3 min) and subsequently fixed and permeabilized with BD Biosciences Fixation/Permeabilization solution (100 µl per 5 million cells) with a 20 min incubation on ice. Samples were then washed twice with 1× BD Perm Wash buffer (800g × 3 min) before staining with an intracellular antibody for GZMB (Supplementary Table 9) at a final concentration of 1 µl antibody per 10 million cells in a volume scaled to cell number (100 µl for every 10 million cells), with a 30 min incubation on ice. Finally, samples were fixed with paraformaldehyde and simultaneous iridium/osmium cell labelling. CyTOF samples were then acquired using the Fluidigm Helios mass cytometer and normalized/concatenated with Fluidigm’s CyTOF software. Further cleaning was done using Mt Sinai’s internal pipeline, which removed acquisition outliers, EQ beads, and low DNA signal events. Demultiplexing was performed using Pd barcoding and cosine similarity, removing low signal-to-noise cells and acquisition multiplets. Each sample was clustered into 1,000 k-means groups. A subset was manually annotated via Clustergrammer2 (https://github.com/ismms-himc/clustergrammer2) to generate a reference matrix. For annotation, cluster similarity to reference cell types was computed, and assignments were made based on highest or consensus similarity. Cell-type labels were then mapped back to single cells for downstream quantification. Antibodies used are listed in the supplemental reporting summary.
Plasma proteomics
Plasma samples underwent protein depletion using perchloric acid to remove the most abundant proteins, enhancing the detection of lower abundance proteins72,73,74. The prepared samples were loaded onto Evotips and analysed using the EVOSEP One system (EVOSEP). The system operated using the 60 samples per day method, which corresponds to a 21 min gradient, optimizing throughput without compromising data quality. The EVOSEP One was coupled to a timsTOF Pro mass spectrometer (Bruker Daltonics) operating in Data-Dependent Acquisition Parallel Accumulation–Serial Fragmentation (DDA-PASEF) mode. HSV1 proteins evaluated included the Swiss-Prot reviewed proteins attributed to human herpesvirus 1 (strain 17, UniProt Proteome ID: UP000009294).
Plasma metabolomics
Plasma metabolite profiling was performed by Metabolon using their in-house standards75,76. Samples were randomized, extracted with methanol precipitation, and divided into fractions for analysis via UPLC–MS/MS under both positive and negative ion modes using RP and HILIC chromatography. Analyses were conducted with a Thermo Q-Exactive mass spectrometer. Metabolites were identified based on retention index, accurate mass (±10 ppm), and MS/MS spectral matching to Metabolon’s reference library, following Metabolomics Standards Initiative guidelines76.
Serum cytokines and chemokines
All samples were analysed using the Olink Inflammation panel (Olink Bioscience), which measures 92 inflammation-related proteins via PEA. In brief, oligonucleotide-labelled antibody pairs bind to target proteins, enabling formation of PCR targets upon proximity. After overnight incubation at 4 °C, PCR amplification was performed, and protein levels were quantified using a microfluidic qPCR system (Biomark, Fluidigm), including built-in controls for quality assurance.
Serum EBV and CMV antibody titre
Serum anti-viral antibodies for EBV (gp350) and CMV (gB) were measured via a Luminex platform as previously described58. The gp350 and gB antigens (Sino Biological) were conjugated to barcoded beads as recommended by Luminex. Serum samples were diluted 1:400 in PBS/0.5% Triton X-100 before 25 μl was added to an assay plate containing the antigen-coupled beads and incubated on an orbital shaker at 500–600 rpm for 2 h at room temperature. Each well also had Assay Chex Control beads (Radix Biosolutions) to measure non-specific binding. The plate was then washed with a Bio-Tak Magnetic washer (ELX-405, Bio-Tek) before a secondary antibody goat-anti human IgG (Fc fragment, NC9822979) or Anti-IgA Fc coupled to Phycoerythrin (501941614) were diluted and added to the plate and incubated on an orbital shaker at 500–600 rpm for 30 min at room temperature. The plate was then washed again with again with a Bio-Tak Magnetic washer (ELX-405, Bio-Tek) before 130 μl of wash buffer was added to the wells and read on a Luminex Flex 3D instrument (lower bound of 50 beads per target antigen). This assay was only performed for half of the cohort (n = 479). The data for the EBV titre values were normalized by regressing the values of the four different Assay Chex control beads as well as the batch and plate before analysis.
For an additional 497 participants, CMV serostatus at visit 1 was also measured using a CMV IgG ELISA assay (Aviva, GWB-BQK12C). Serum samples were assessed in duplicate, with an average antibody index value >1.1 considered positive, <0.9 considered negative, and values between 0.9 and 1.1 equivocal per manufacturer specifications. For this study, equivocal status was considered seropositive. The resulting calculated serostatus from both CMV assays were combined to evaluate rate of serostatus at hospital admission between CMV transcript positive and negative patients (Fig. 3b).
Statistics and reproducibility
All IMPACC sites followed a standard protocol55 for biological sample collection. To mitigate batch effects, samples were randomized to batches while ensuring longitudinal samples from the same individual were run in the same batch. The randomization was stratified by disease severity (mild and moderate versus severe) and age (younger versus older) with representation across batches. Furthermore, race, ethnicity, gender, and enrolment site were then confirmed to be well represented across batches. As this was an observational study, we prioritized biological replicates over technical replicates, except where needed to evaluate for batch effects. Thus, all data used in this study were reflective of data collected as single measurements for each participant at each time point, unless otherwise specified in the methods.
All P values calculated in this manuscript were adjusted using the Benjamini–Hochberg procedure and are indicated as adjusted P values (circumstances where no adjustments were necessary report as only P values). Across all multi-omic analyses, adjustments were corrected for all comparisons or models ran on a per virus basis. The exact statistical approaches used for each analysis are detailed below.
Clinical features and demographics
For testing the association of detection of chronic viral transcripts with trajectory groups and age, we used cumulative link mixed modelling (clmm) from the ordinal (v2019.12-10) R package77. Due to both COVID-19 severity and age quantiles being ordinal, cumulative link mixed modelling allowed for this ordinal relationship to be accounted for in addition to including enrolment site as a random effect. However, due to the TG4 and TG5 contributing a majority of the endotracheal aspirate samples, for comparison of the endotracheal aspirate viruses a Fisher’s exact test comparing only TG4 and TG5 was used instead of a clmm. The following R formulae were used with the clmm2 function from the ordinal (v 2019.12-10) R package77:
$$\rmTrajectory\_\rmgroup \sim \rmvirus\_\rmstatus,\rmrandom=\rmenrollment\_\rmsite$$
$$\beginarrayl\rmAdmit\_\rmage\_\rmquintile \sim \rmvirus\_\rmstatus+\rmtrajectory\_\rmgroup,\rmrandom\\ \,=\,\rmenrollment\_\rmsite\endarray$$
For the testing of association of virus positivity status with ethnicity, sex, and steroid and remdesivir administration in Extended Data Fig. 6b–e, a chi-squared test of independence was calculated using the rstatix (v0.7.2) R package78.
For the testing of virus positivity status with long-term mortality within trajectory group 4, a Cox proportional hazards model was used that included steroid and remdesivir administration as fixed effects and enrolment site as a random effect. All clinical outcomes, including mortality, were captured by clinical staff from the electronic medical record in accordance with protocol and then verified by the IMPACC Clinical and Data Coordinating Center. If death was not ascertained, the model was right censored with the date of participant lost to follow up or completion of the study. The following R formula was used with the coxme function from the coxme R package (v2.2-16)79:
$$\beginarrayl\rmSurv(\rmtime\_\rmto\_\rmevent,\rmright\_\rmcensoring) \sim \rmever\_\rmsteroids\\ \,+\,\rmever\_\rmremdesivir+\rmvirus\_\rmstatus+(1|\rmenrollment\_\rmsite)\endarray$$
For testing of association with other clinical features including complications, comorbidities and medication usage, a logistic mixed effect model was used that also included sex, age quintile and trajectory group as fixed effects and enrolment site as a random effect. Of note, participants positive for a virus in a given tissue were only compared against participants who also had the respective tissue sequenced at least once and were negative at all time points checked. The following R formula was used with the glmer function from the lme4 R package (v 1.1-28)80:
$$\beginarrayl\rmClinical\_\rmfeature \sim \rmvirus\_\rmstatus+\rmsex+\rmage\_\rmquintile\\ \,+\,\rmtrajectory\_\rmgroup+(1|\rmenrollment\_\rmsite)\endarray$$
To further decouple association of Anelloviridae with COVID-19 severity, immunosuppressive medications and age, we conducted an additional logistic mixed effect model that included sex, age quintile, trajectory group and immunosuppressive medication status as fixed effects with enrolment site as a random effect. The following R formula was used with the glmer function from the lme4 R package (v 1.1-28)80:
$$\beginarrayl\rmAnelloviridae\_\rmstatus \sim \rmever\_\rmimmsupp+\rmtrajectory\_\rmgroup\\ \,+\,\rmsex+\rmdiscretized\_\rmadmit\_\rmage\_\rmquantile+(1\rm\_\rmsite)\endarray$$
For testing of association of virus detection status with the PASC PRO groups, a linear model was used that also included sex, age quintile, trajectory group and immunosuppressed status by medication as fixed effects in the model. The following R formula was used with the glmer function from the lme4 R package (v 1.1-28)80:
$$\beginarrayl\rmPRO\_\rmgroup \sim \rmvirus\_\rmstatus+\rmimmunosuppressed\_\rmstatus\\ \,+\,\rmtrajectory\_\rmgroup+\rmsex+\rma\rmge\_\rmquintile+(1\rmenrollment\_site)\endarray$$
Cellular immunophenotyping
For testing the association of participant events positive for viruses with changes in immunophenotypes of circulating cells, a linear mixed effect model was used that also included trajectory group, sex, age quintile, and visit number as additional main effects in addition to enrolment site and participant as nested random effects in the model. The normalized abundances for cell types were computed by calculating the relative abundance after removing granulocytes from the total before a log1p transformation and scaling. The following R formula was used with the lme function from the nlme (v 3.1-149) R package81:
$$\beginarrayl\rmNormalized\_\rmcelltype\_\rmabundance \sim \rmvirus\_\rmstatus+\rmtrajectory\_\rmgroup\\ \,+\,\rmsex+\rmdiscretized\_\rmadmit\_\rmage\_\rmquantile+\rmevent\_\rmtype,\rmrandom\\ \,= \sim 1|\rmenrollment\_\rmsite/\rmparticipant\_\rmid\endarray$$
Serum cytokines and plasma metabolomics
To evaluate both the serum proximity extension array cytokine assay (Olink Inflammation panel) and the plasma metabolomics, GAMM from the gamm4 (v 0.2-6) R package82 was used to evaluate for differences in individual analytes between patients who had detected transcripts for a chronic virus compared to patients who never had human-infecting viral transcripts detected (other than for SARS-CoV-2). Analytes were modelled against days from admission using cubic regression splines with interactions of both status for a given chronic virus (that is, detected transcript at any collected time point) and trajectory group in addition to fixed effects of status for the chronic virus being evaluated, trajectory group, sex, age at time of admission sorted into quintiles, and SARS-CoV-2 nasal viral RPM at the time of that sample. As chronic viral status is both a main effect and interaction term in the model, we used a lower adjusted P value cutoff of 0.01 to account for the fact that a feature was significant if either term was significant. Only participant visits with both PBMC and nasal transcriptomics were used for this analysis. The following R formula was used with the gamm function from the gamm4 (v0.2-6) R package82:
$$\beginarrayl\mathrmAnalyte \sim \rms(\mathrmdays,\mathrmbs= \mbox` \mathrmcr\mbox’)+\rms(\mathrmdays,\mathrmbs= \mbox` \mathrmcr\mbox’,\mathrmby= \mbox` \mathrmvirus\_\mathrmstatus\mbox’)\\ \,+\,\rms(\mathrmdays,\mathrmbs= \mbox` \mathrmcr\mbox’,\mathrmby= \mbox` \mathrmtrajectory\_\mathrmgroup\mbox’)+\mathrmvirus\_\mathrmstatus\\ \,+\,\mathrmsex+\mathrmtrajectory\_\mathrmgroup+\mathrmage\_\mathrmquintile\\ \,+\,\mathrmsarscovs2\_\mathrmnasal\_\log \_\mathrmrpm,\mathrmrandom\\ \,= \sim (1|\mathrmenrollment\_\mathrmsite/\mathrmparticipant\_\mathrmid)\endarray$$
Nasal and PBMC RNA-seq
To analyse the signature of host gene expression associated with chronic viruses, the limma (v 3.46.0) R package83 was used for both the nasal and PBMC RNA-seq to evaluate differential expressed genes associated with participants who had detectable chronic viral transcripts. The following R formula was used:
$$\beginarrayl \sim \rmage\_\rmquintile+\rmsex+\rmvisit\_\rmnumber+\rmtrajectory\_\rmgroup\\ \,+\,\rmsarscov2\_\rmnasal\_\log \_\rmrpm+\rmvirus\_\rmstatus\endarray$$
Upregulated and downregulated differentially expressed genes were then evaluated separately with hypergeometric pathway enrichment using the Reactome database (v95)84 and the clusterProfiler R package (v 3.18.1)85.
Reporting summary
Further information on research design is available in the Nature Portfolio Reporting Summary linked to this article.

