


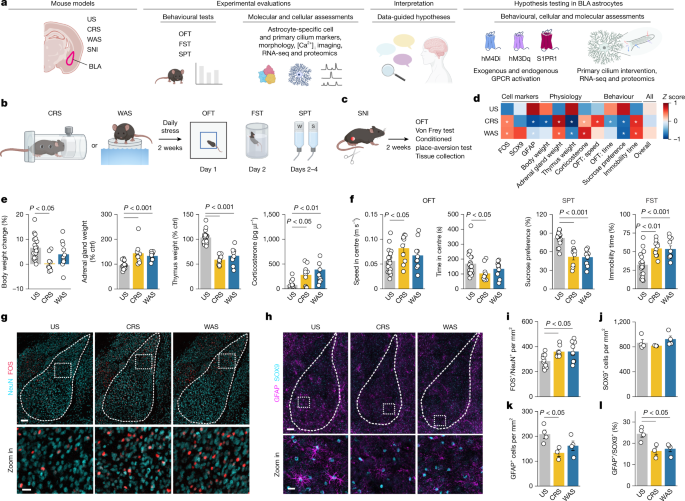
Mouse models
All animal experiments at the University of California Los Angeles (UCLA) were conducted in accordance with the US National Institutes of Health (NIH) Guide for the Care and Use of Laboratory Animals and were approved by the Chancellor’s Animal Research Committee at UCLA. The UCLA ARC protocol numbers for the experiments were 2009-043, 2020-002, 2017-039 and 2022-016. All mice were housed with food and water available ad libitum in a 12-h light–dark environment at temperatures of 20–22 °C with 40–60% humidity. All mice were 2–5 months old when used for experiments, were healthy with no obvious behavioural phenotype, were not involved in previous studies and were euthanized during the light cycle. Wild-type C57BL/6N mice were maintained in an in-house breeding colony or purchased from The Jackson Laboratory (JAX) or Taconic Biosciences. Approximately equal numbers of male and female mice were used and no differences were observed between sexes. RiboTag mice (B6N.129-Rpl22tm1.1Psam/J, JAX stock 011029) were acquired from JAX and crossed with Aldh1l1cre/ERT2 BAC mice (B6N.FVB-Tg(Aldh1l1-Cre/ERT2)1Khakh/J, JAX stock 029655) fully backcrossed to C57BL/6NTac background in an in-house breeding colony. GCaMP6f mice (Ai95D (C57BL/6J), JAX stock 028865) were acquired from JAX and crossed with Aldh1l1cre/ERT2 BAC mice (B6N.FVB-Tg(Aldh1l1-Cre/ERT2)1Khakh/J, JAX stock 029655) in an in-house breeding colony. Ponesimod behavioural experiments were performed at ONO Pharmaceutical and were approved by the Institutional Animal Care and Use Committee. Arl13bf/f;Aldh1l1cre/ERT2 mice were group housed (4–5 mice of the same sex per cage) in a controlled environment (12-h light–12-h dark cycle at 21 °C) with unrestricted access to water and a standard chow diet at the University of Calgary, and experiments were approved by the University of Calgary Health Sciences Animal Care Committee, Health Sciences Animal Care Committee, and all experiments were completed in accordance with the Canadian Council of Animal Care guidelines. Arl13bf/f and Ift88f/f mice72,73 were a gift from J. Guo and were maintained in an in-house breeding colony at UCLA. All mice were assigned to experimental groups at random. Because of the experimental design and availability of resources, blinding was not always feasible. For behavioral experiments, we minimized subjectivity as much as possible by using automated analysis software whenever possible.
Ethics statement
Human postmortem brain tissue samples were obtained from the Harvard Brain Tissue Resource Center, a NIH NeuroBioBank repository. All procedures were approved by the Mass General Brigham Institutional Review Board and conducted in accordance with institutional guidelines, NIH regulations and the Health Insurance Portability and Accountability Act. Written informed consent for brain donation was obtained from the legal next-of-kin or legally authorized representative. All samples were de-identified before distribution.
Tamoxifen injections for inducible gene expression
To selectively express RPL22–HA in astrocytes, hemizygous Aldh1l1cre/ERT2;RiboTag mice74,75 were injected with 75 mg kg–1 tamoxifen (Sigma-Aldrich, T5648) dissolved in corn oil once per day for 5 consecutive days at 6–8 weeks of age and were euthanized 2–3 weeks after tamoxifen injections for astrocyte RNA-seq experiments. Arl13bf/f;Aldh1l1cre/ERT2 mice were administered tamoxifen (200 μg per mouse per day) from postnatal days 7–9 and were euthanized 4 weeks later for RNA-seq experiments.
CRS
Mice were weighed and placed in restrainers (diameter of 2.5 cm × 9.5 cm, 551-BSRR, Plas-Labs) for 6 h each day (from 10:00 to 16:00) for 14 consecutive days. US mice were weighed and kept in their home cages. Light intensity during restraint stress was maintained at approximately 50 lux. All mice were returned to their home cages at the end of the stress period.
WAS
Mice were weighed and placed on a platform (diameter of 5 cm × 10 cm) attached to the bottom of a plastic tank (45-cm long × 25-cm wide × 25-cm high) for 2 h each day (from 10:00 to 12:00) for 14 consecutive days. The plastic tank was filled with water (25 °C) up to 1 cm below the top of the platform. US mice were weighed and kept in their home cages. Light intensity during WAS was maintained at approximately 50 lux. All mice were returned to their home cages at the end of the stress period.
SNI model
All surgical procedures were conducted under general anaesthesia using continuous isoflurane (induction at 5%, maintenance at 1–2% v/v). The depth of anaesthesia was monitored continuously and adjusted as necessary. After the induction of anaesthesia, mice were administered with 0.1 mg kg–1 buprenorphine (Buprenex) subcutaneously before surgery. The surgical incision site was then cleaned 3 times with 10% povidone iodine and 70% ethanol (v/v). The skin and muscles were incised to expose the sciatic nerve. The common peroneal nerve and tibial nerve, two of the three terminal branches of the sciatic nerve, were tightly ligated with 6-0 silk sutures and then cut distally, whereas the sural nerve was left intact. The muscles and skin were then sutured with 4-0 silk sutures. In the sham surgery, only the sciatic nerve was exposed, and afterwards, the muscles and skin were sutured. After surgery, mice were allowed to recover overnight in cages placed partially on a low-voltage heating pad. Buprenorphine was administered twice a day for up to 2 days after surgery. The mice were allowed to recover for 2 weeks after SNI before performing physiological and behavioural evaluations comprising OFTs, conditioned-thermal place-aversion tests and Von Frey tests. As expected76, SNI resulted in the development of mechanical and thermal allodynia, as well as hyperalgesia, in the area innervated by the sural nerve76.
OFT
The open-field chamber consisted of a square arena (40 cm × 40 cm) enclosed by plastic walls (30 cm in height). The centre of the arena was defined as the area 10 cm away from the chamber walls. The light intensity in the centre of the open field was maintained at 50 lux. The locomotor activity of the mice was recorded for 15 min using a camera located above the open-field chamber. The time spent, centre entries and speed in the centre, as well as the total distance travelled, were analysed using the automated video tracking software ANY-maze (v.6.3, Stoelting).
SPT
The mice were switched to individual housing and given two water bottles to acclimate them to the bottles. On day 2, the mice were given two bottles: one containing water and the other containing 1% sucrose. On day 3, the mice were fasted and again given two bottles, one with water and the other with 1% sucrose, both of which were pre-weighed. The mice had access to these bottles for 16 h (from 18:00 to 10:00). After the test period, the weight of each bottle was measured, and sucrose preference (%) was calculated using the following formula: (1% sucrose intake/(water intake + 1% sucrose intake)) × 100. The mice were euthanized after the SPTs.
FST
Mice were placed in a cylinder (diameter of 12 cm ×30 cm in height) filled with water to a depth of 20 cm, and their swimming behaviour was recorded with a video camera for 6 min. The light intensity of the test area was maintained at 50 lux. The time the mice remained immobile was recorded.
Von Frey test
The pain threshold was measured on day 21 after SNI surgery using von Frey filaments. The following 7 different strengths of von Frey filaments were used: 0.04, 0.07, 0.16, 0.4, 0.6, 1 and 2 g. Mice were placed in individual small cages on a wire mesh floor and allowed to acclimate for up to 1 h. The von Frey filaments were applied vertically to the plantar surface of the hind paw on the SNI-treated side from underneath the wire mesh floor. A quick withdrawal response or paw flicking was considered a positive pain response, and pain response was measured using a previously described up–down method77.
Conditioned-place temperature-aversion test
The conditioned-place temperature-aversion test was conducted using an apparatus (33 × 16.5 ×30 cm, Thermal Place Preference-2 (BIO-T2CT, Bioseb)) equipped with two plates for which temperatures can be individually controlled and enclosed by Plexiglass. On the first day, mice were placed in the centre of the apparatus with both plates set to 25 °C, and the mice were allowed to freely explore the plates for 10 min to acclimate to the apparatus. Subsequently, the test plate was set to 19 °C whereas the reference plate remained at 25 °C, and visual cues were placed on the outside of the apparatus on the test plate side. The mice were placed in the centre of the apparatus and allowed to freely explore the plates for 10 min during two conditioning trials, with an interval of approximately 3 h between trials. On the second day, both the test plate and the reference plate were set to 25 °C, with visual cues still placed on the outside of the apparatus on the test plate side. The mice were placed in the centre of the apparatus and allowed to explore the plates freely for 10 min. The locomotor activity of the mice was recorded using a camera located above the apparatus, and the time spent on each plate was automatically analysed using Bioseb software. Place preference (%) was calculated using the following formula: (time spent on test plate/(time spent on test plate + time spent on reference plate)) × 100.
Blood and tissue collection
After anaesthetizing the mice with isoflurane, and following euthanasia, an incision was made in the abdomen to collect 0.5 ml blood from the abdominal vena cava, which was then placed into a 1.5 ml tube containing heparin. Subsequently, the adrenal glands from both sides and the thymus were excised and their wet weights were measured. The collected blood was centrifuged at 1,500g for 15 min to obtain plasma for corticosterone measurement. Plasma corticosterone levels were measured using an ELISA kit (Enzo, ADI-900-097), according to the manufacturer’s instructions.
Ponesimod treatment
Ponesimod (30 mg kg–1) or vehicle (0.25% (w/v) methylcellulose with 0.05% (v/v) Tween 80) was intraperitoneally administered once daily, 1 h before the start of CRS. Moreover, on the days of the behavioural tests, a single dose was given 1 h before the start of each test. After the tests were completed, blood and brain tissue samples were collected for plasma corticosterone measurements and IHC, respectively. US and CRS mice received identical ponesimod doses, whereas the vehicle controls received just the vehicle. For [Ca2+]i imaging experiments, the mice received a single injection of ponesimod or vehicle. We comment briefly on the known off-target effects of ponesimod. The FDA drug approval package for ponesimod (application number: 213498; www.accessdata.fda.gov/drugsatfda_docs/nda/2021/213498Orig1s000TOC.html) reports known off-target binding activity. Ponesimod showed greater than 50% inhibition of binding to three targets: endothelin ETA receptor, around 74% inhibition; monoamine oxidase MAO-B, about 62% inhibition; and protein serine/threonine kinase Ca2+/calmodulin-dependent II (CaMKII), about 63% inhibition. However, several factors were suggested to show that these off-target effects are negligible. Principally, the approximately 1,750-fold difference between the inhibition constant of S1PR1 (5.7 nM) and the screening concentration (10 μM) suggests that at clinically relevant doses, the effects of ponesimod will be dominated by S1PR1 activation. Nonetheless, off-target effects should be considered in future studies that develop S1PR1 or the other GPCRs we report here.
Neuroinflammation induction with LPS
Neuroinflammation was induced with 5 mg kg–1 intraperitoneal injections of LPS, exactly as previously reported78. After 24 h, the effects of neuroinflammation were confirmed by reduced ambulation metrics in OFTs, and the mice were euthanized for tissue collection.
Stereotaxic microinjections of AAVs
All surgical procedures were conducted under general anaesthesia using continuous isoflurane (induction at 5%, maintenance at 1–2% v/v). The depth of anaesthesia was monitored continuously and adjusted as necessary. After the induction of anaesthesia, the mice were fitted into a stereotaxic frame with their heads secured by blunt ear bars and their noses placed into a veterinary-grade anaesthesia and ventilation system (VetEquip). Mice were administered with 0.1 mg kg–1 buprenorphine (Buprenex) subcutaneously before surgery. The surgical incision site was then cleaned 3 times with 10% povidone iodine and 70% ethanol (v/v). Skin incisions were made, followed by two craniotomies of 2–3 mm in diameter using a small steel burr (Fine Science Tools) powered by a high-speed drill (K.1070, Foredom). Saline (0.9%) was applied onto the skull to reduce heating caused by drilling. Bilateral viral injections were performed using a stereotaxic apparatus (David Kopf Instruments) to guide the placement of bevelled glass pipettes (1B100-4, World Precision Instruments). For the BLA, the following coordinates were used: 1.45 mm posterior to bregma; 3.20 mm lateral to the midline; and 3.75 mm from the pial surface. AAVs were injected by using a syringe pump (Pump11 PicoPlus Elite, Harvard Apparatus). After AAV microinjections, glass pipettes were left in place for at least 10 min before being slowly withdrawn. Surgical wounds were closed with external 4-0 silk sutures. After surgery, mice were allowed to recover overnight in cages placed partially on a low-voltage heating pad. Buprenorphine was administered twice a day for up to 2 days after surgery. AAV-injected mice were used for experiments at least 2 weeks after surgery. All AAV titres were adjusted to 1.0 × 10¹³ genome copies per ml with sterile 0.1 M PBS. The following viruses were used: 0.15 μl AAV2/5 GfaABC1D-tdTomato (Addgene, 44332); 0.15 μl AAV2/5 GfaABC1D-hM4Di–mCherry (Addgene, 92286); 0.15 μl AAV2/5 GfaABC1D-hM3Dq–mCherry (Addgene, 92284); 0.15 μl AAV2/5 GfaABC1D-cyto–GCaMP6f (Addgene, 52925); 0.15 μl AAV2/5 GfaABC1D-LCK–GFP (Addgene, 105598); 0.15 μl AAV2/5 GfaABC1D-LCK–BioID2-BioID2–HA (Addgene, 176741); 0.15 μl AAV2/5 GfaABC1D-eGFP (Addgene, 176861); and 0.15 μl AAV2/5 GfaABC1D-Cre-4x6T (Addgene, 196410).
IHC
For transcardial perfusion, mice were euthanized with isoflurane and perfused with 0.1 M PBS followed by 10% buffered formalin (Fisher SF100-20). After gentle removal from the skull, the brain was post-fixed in 10% buffered formalin overnight at 4 °C. The brains were then cryoprotected in 30% sucrose with 0.1 M PBS solution for at least 48 h at 4 °C until use. Serial coronal sections (40 μm) containing the amygdala were prepared using a cryostat microtome (Leica) at −20 °C and processed for IHC. Sections were washed 3 times in 0.1 M PBS for 5 min each and then incubated in a blocking solution consisting of 10% normal goat serum in 0.1 M PBS with 0.5% Triton-X100 for 1.5 h at room temperature with agitation. Sections were then incubated with agitation in primary antibodies diluted in blocking solution overnight at 4 °C. The following primary antibodies were used: guinea pig anti-NeuN (1:1,000; Synaptic Systems, 266004); rabbit anti-FOS (1:1,000; Synaptic Systems, 226008); chicken anti-mCherry (1:1,000; Abcam, ab205402); chicken anti-GFAP (1:1,000; Abcam, ab4674); rabbit anti-S100β (1:1,000; Abcam, ab41548); guinea pig anti-S100β (1:500; Nittobo, MSFR105350); chicken anti-S100β (1:500; Synaptic Systems, 287006), rabbit anti-HA tag (1:1,000; Abcam, ab9110); rabbit anti-septin 2 (1:100; Thermo Scientific, 11397-1-AP); rabbit anti-ARL13B (1:500; Proteintech, 17711-1-AP); rat anti-ARL13B (1:500; BiCell Scientific, 90413); rabbit anti-S1PR1 (1:50; Invitrogen, PA1-1040); rabbit anti-AC3 (1:4,000; Invitrogen, PA5-35382); rabbit anti-SOX9 (1:500; Millipore, AB5535); goat anti-collagen IV (1:500; Novus Bio, NBP1-26549); and biotinylated WFA (1:1,000; Vector labs, B-1355-2). For IHC of collagen IV, the sections were pre-treated with pepsin (Sigma, R2283) for 5 min at 37 °C and washed with PBS at 27 °C for 8 min. Sections were washed 4 times in PBS-T for 5 min and then incubated at room temperature for 1 h with secondary antibodies diluted in blocking solution. The following Alexa-conjugated secondary antibodies (1:1,000; Molecular Probes) were used: Alexa Fluor 488 goat anti-guinea pig (A11073), Alexa Fluor 546 goat anti-chicken (A11040), Alexa Fluor 647 goat anti-rabbit (A21244) and streptavidin Alexa Fluor 647 conjugate (S21374). The sections were rinsed 3 times in PBS-T for 5 min and then 3 times in 0.1 M PBS for 5 min before being mounted on microscope slides and sealed in ProLong Glass Antifade (P36984, Invitrogen). Fluorescent images were taken using UPlanXApo ×4 (NA 0.16), UPlanXApo ×10 (NA 0.40), UPlanFL N ×40 (NA 1.30) and UPlanXApo ×60 (NA 1.42) objective lenses on a confocal laser-scanning microscope (FV3000; Olympus) using Fluoview software (Olympus). Laser settings for imaging were kept the same in each experiment. Images represent maximum-intensity projections of optical sections with a step size of 0.5–1.0 μm. Images were processed usinf ImageJ (v1.53u–1.54p). Non-ciliary ARL13B rabbit antibody background staining was sometimes thresholded out of the figure images to improve identification of the primary cilium compared with the background. Example raw images from flattened z stacks are provided in Fig. 2n and Extended Data Fig. 4h. No thresholding was applied to IHC images showing primary cilium staining with ARL13B rat and AC3 antibody, or to any other images.
3D rendering of IHC images was performed using Imaris software (Bitplane, Oxford Instruments). Raw image stacks (0.5 µm) were imported into Imaris and visualized using the Surpass mode to generate 3D representations of the labelled structures. Then, using Imaris software, the following steps were performed to reconstruct the surface and to calculate the volume: selection of a region of interest containing the cilium for segmentation, smoothing with a surface grain size detail of 0.3–0.4 µm (most often 0.4 µm), threshold using the background subtraction method with diameter of largest sphere of 1–1.6 µm (most often 1 µm). This was followed by manual value threshold selection guided by (1) maintaining maximum resemblance to IHC cilium staining captured and (2) ensuring the cilium was rendered as one volume. For rendering of the astrocyte soma surface, the same protocol was followed except that thresholding was performed with the absolute intensity method instead of the background subtraction method. 3D renderings were adjusted for transparency, colour and lighting to facilitate visualization. Volume analysis data were extracted from the 3D reconstructions using the Imaris MeasurementPro module.
RNAscope of mice and human tissue
Fixed-frozen tissue was processed as described above. Serial coronal sections (20 μm) containing amygdala were prepared using a cryostat microtome (Leica) at −20 °C and mounted immediately onto glass slides. Dual ISH–IHC was performed using a Multiplex RNAscope (v.2) with integrated co-detection workflow (ACDBio, 323180 and 323110). Sections were baked for 30 min at 60 °C. Sections were washed for at least 15 min in 0.1 M PBS and then incubated in target retrieval reagents for 5 min at 95 °C. After washing with ddH2O twice, the sections were dehydrated with 100% ethanol and dried at room temperature. Sections were then incubated with primary antibody guinea pig anti-S100β (1:500; Nittobo, MSFR105350) or chicken anti-S100β (1:500; Synaptic Systems, 287006) overnight at 4 °C. Sections were then incubated with protease (ACDBio, 322330) for 30 min at 40 °C. The sections were washed with ddH2O twice for 1 min each and then incubated with the corresponding probe for 2 h at 40 °C: Mm-Arl6-C2 (ACDBio, 492301-C2), a custom probe for mouse ARL3-C1 (ACDBio) or Mm-S1PR1-C2 (ACDBio, 426001-C2).
The sections were incubated in AMP 1-FL for 30 min, AMP 2-FL for 30 min and AMP 3-FL for 15 min at 40 °C while washing in wash buffer (ACDBio, 310091) between incubations. The HRP-C1 signal was developed with Opal 520 fluorophore (Akoya Biosciences, FP1487001KT). The HRP-C2 signal was developed with Opal 570 fluorophore (Akoya Biosciences, FP1488001KT). All incubations at 40 °C or 60 °C were performed in a HybEZ hybridization system (ACDBio). Last, sections were incubated with Alexa Fluor goat secondary antibodies described in the IHC section for 30 min at room temperature. Images were obtained in the same way as for IHC (described above) with a step size of 1 μm. Images were processed using ImageJ (v.1.53u–1.54p). Astrocyte somata were labelled with S100β, and the presence of puncta in each soma was quantified.
For RNAscope of human brain tissue, a RNAscope Multiplex Fluorescent Reagent kit v.2 (all reagents from ACDBio) was used with the astrocyte-specific C1 probe ALDH1L1 and the S1PR1 target C2 probe according to the user manual with modifications. In brief, 18 μm coronal sections of fresh-frozen human amygdala samples from four neurotypical individuals (n = 2 male and n = 2 female individuals) were fixed with 4% paraformaldehyde in PBS for 45 min at 4 °C, rinsed with PBS and dehydrated with gradient ethanol solutions. Endogenous peroxidase activity was quenched with hydrogen peroxide solution for 10 min, and protease IV reagent was used for 30 min for proteolytic tissue digestion. After hybridization steps, the signal was developed with TSA Vivid Fluorophores 570 and 650, both at 1:1,000 dilution in TSA buffer. Slides were then counterstained with DAPI, and lipofuscin autofluorescence was quenched by incubating the slides for 1 min with 1× TrueBlack solution (Biotum, 23007). After autofluorescence quenching, slides were rinsed 3 times with PBS and mounted with ProLong Gold Antifade reagent (Thermo Fisher). Four z stack images under ×20 magnification with a step size of 1 μm were acquired per sample from the basolateral region of the amygdala with a Leica SP8 confocal microscope. A total of 632 ALDH1L1-positive nuclei were manually counted using Fiji. The data are expressed as the percentage of S1PR1-positive astrocytes per each case.
Calcium imaging of astrocytes in brain slices
In brief, mice were anaesthetized with isoflurane and decapitated with sharp shears. The brains were placed and sliced in ice-cold modified artificial cerebrospinal fluid (aCSF) containing the following components: 194 mM sucrose, 30 mM NaCl, 4.5 mM KCl, 1 mM MgCl2, 26 mM NaHCO3, 1.2 mM NaH2PO4 and 10 mM d-glucose, saturated with 95% O2 and 5% CO2. A vibratome (DSK Microslicer; Ted Pella) was used to cut 300 μm brain sections. The slices were allowed to equilibrate for 30 min at 33 °C in normal aCSF containing the following components: 124 mM NaCl, 4.5 mM KCl, 2 mM CaCl2, 1 mM MgCl2, 26 mM NaHCO3, 1.2 mM NaH2PO4 and 10 mM d-glucose, continuously bubbled with 95% O2 and 5% CO2. Slices were then stored at 21–23 °C in the same buffer until use. All slices were used within 6 h of slicing. Brain-slice imaging was performed at room temperature (21–23 °C). Cells for all the experiments were imaged using a confocal microscope (Fluoview 1000; Olympus) with a ×40 water-immersion objective lens with 0.8 NA and a digital zoom of 2–3. We used the 488 nm line of an Argon laser, with the intensity adjusted to 5–10% of the maximum output of 10 mW. The emitted light pathway consisted of an emission high-pass filter (505–525 nm) before the photomultiplier tube. Astrocytes were typically around 25 μm below the slice surface and were scanned at 1 frame per s for imaging sessions. For pharmacological activation of endogenous GPCRs, agonists were dissolved in water. The DREADD agonist DCZ and the S1PR1 agonist ponesimod were dissolved in DMSO. Stock solutions were diluted in aCSF immediately before use. Analyses of time-lapse image series were performed using ImageJ (v.2.1, NIH). The xy drift was corrected using ImageJ, and cells with z drift were excluded from analyses. Time traces of fluorescence intensity were extracted from the regions of interest and converted to change in fluorescent (ΔF/F) values. Traces of the regions of interest were extracted using GECIquant software (v.1.0). Extracted Ca2+ signals were analysed using custom R (v.4.4.1) scripts. Events were identified on the basis of amplitudes that were at least threefold above the baseline noise of the ΔF/F trace and analysed using the findpeaks function (pracma v.1.9.9) for event identification and quantification, the AUC function (DescTools v.0.99.55) for area under the curve calculation and tidyverse (v.2.0.0) for data manipulation.
Extraction of astrocytic RNA from Aldh1l1
cre/ERT2;RiboTag mice
Extraction of astrocyte-derived RNA from Aldh1l1cre/ERT2;RiboTag mice was done as previously described75. In brief, tissue from the amygdala were collected from 16 animals of 2–3-month-old Aldh1l1cre/ERT2;RiboTag mice (8 males and 8 females, 4 mice pooled per sample, 4 samples per group) and homogenized. RNA was extracted from 10–20% of cleared lysate as input containing RNA from all cell types using a RNA extraction kit (Qiagen, 74034). The remaining lysate was incubated with 5 µl mouse anti-HA antibody (about 1:160, BioLegend, 901514) for 4 h at 4 °C followed by addition of magnetic beads (Thermo Scientific, 88817) and overnight incubation at 4 °C. RNA was extracted from the IP samples containing astrocyte-enriched RNA using an RNA extraction kit (Qiagen, 74034). RNA concentration and quality were assessed using an Agilent 2100 Bioanalyzer.
Astrocyte RNA-seq and analysis
RNA samples with RNA integrity number greater than 7.8 were used for subsequent multiplexed library preparation with TruSeq Stranded Total RNA with Ribozero Gold, except the MACS and the Ift88f/f bulk samples, for which library preparation was done with SMART-Seq mRNA and NexteraXT. For each experiment, all samples were multiplexed into a single pool to avoid batch effects. Sequencing was performed on NovaSeq 6000 or NovaSeq × Plus, which produced at least 80 million reads per sample. Demultiplexing was performed using Illumina Bcl2fastq2 (v.17). Reads were aligned to the mouse mm10 reference genome using the STAR spliced read aligner (v.2.7), and 75 ± 16% of the reads were uniquely mapped. Previously reported datasets of the 13 regions of the CNS58 were combined with the amygdala dataset by batch correction using Removing Unwanted Variation (RUVr). All DEGs were obtained using limma-voom. Differential gene expression analysis was performed with the Bioconductor package limmaVoom (v.3.60) with the adjusted P value threshold set at <0.05. Astrocyte-enriched genes were defined as those with log2[IP/input] > 1, adjusted P < 0.05 and IP FPKM > 1. For analysis of astrocyte region-specific genes, genes were analysed by comparing IP samples with the average of IP samples from the other 13 regions using limma-voom. GO pathway analysis was performed using Enrichr (https://maayanlab.cloud/Enrichr/). Unwanted variation in the US, CRS and WAS datasets was removed using RUVr. S1pr1 RNA-seq expression in cortex astrocytes for Fig. 6 was calculated by averaging that of the SCX, the MCX and the VCX58.
Cilium-related genes
The list of 770 cilium-related genes to compute region enrichment was obtained by combining genes from the GO terms ‘cilium’ (GO:0005929), ‘cilium assembly’ (GO:0060271), ‘cilium organization’ (GO:0044782) and ‘axoneme’ (GO:0005930). The final list of 770 genes shared 60% overlap with Syscilia Gold Standard (SCGv1) of known ciliary components79 and 42% overlap with a longer list of cilia-related genes from CiliaCarta80. The full list of genes is provided in Source Data Fig. 4.
In vivo BioID2 protein biotinylation and pull-downs
Three weeks after AAV microinjection of BioID2 or GFP (control), mice were treated with a subcutaneous injection of biotin (24 mg kg–1; Millipore Sigma, RES1052B-B7) dissolved in sterile 0.1 M PBS once per day for 7 consecutive days. Mice were used 16 h after the last biotin injection.
Purification of biotinylated proteins was conducted as previously described81,82. Eight mice were used for each biotinylated protein purification. Amygdala tissue (8 mice pooled per sample, 4 samples per group, equal numbers of male and female mice) was dounce-homogenized in lysis buffer A (1 mM EDTA, 150 mM NaCl and 50 mM HEPES pH 7.5 supplemented with Halt protease inhibitor (Thermo Scientific, 78429)). Immediately after homogenization, lysis buffer B (2% sodium deoxycholate, 2% Triton-X, 0.5% SDS, 1 mM EDTA, 150 mM NaCl and 50 mM HEPES pH 7.5) was added. The lysed samples were sonicated for 5 min at 60% power and then centrifuged at 15,000g for 15 min at 4 °C. The resulting supernatant was then ultracentrifuged at 100,000g for 30 min at 4 °C. SDS was added to the supernatant to obtain a final concentration of 1%. The sample was then boiled at 95 °C for 5 min. The sample was cooled on ice and incubated with 35 μl equilibrated anti-pyruvate carboxylase (5 μg; Abcam, 110314) conjugated agarose beads (Pierce, 20398) for 4 h at 4 °C while rotating. Subsequently, the sample was centrifuged at 500g for 5 min at 4 °C and the supernatant was incubated with Pierce streptavidin magnetic beads (Thermo Scientific, 88817) at 4 °C overnight while rotating. The magnetic beads were then washed twice with 0.2% SDS, twice with wash buffer (1% sodium deoxycholate, 1% Triton-X and 25 mM LiCl), twice with 1 M NaCl and 5 times with 50 mM ammonium bicarbonate. Proteins bound to the beads were then eluted in elution buffer (5 mM biotin, 0.1% Rapigest SF surfactant and 50 mM ammonium bicarbonate) at 60 °C for a minimum of 2 h.
Analysis of biotinylated proteins by mass spectrometry
Eluates obtained after IP were subjected to reduction and alkylation using 5 mM Tris(2-carboxyethyl)phosphine and 10 mM iodoacetamide, respectively, followed by treatment with single-pot, solid-phase-enhanced sample preparation protocol (SP3) for clean-up of protein. The eluates obtained after SP3 protein clean-up were subjected to overnight digestion with Lys-C and trypsin at 37 °C. The digested peptides were treated with SP3-based peptide clean-up protocol, dried and subsequently analysed by LC–MS/MS. In brief, reversed-phase chromatography was used to separate peptides on Bruker PepSep C18 columns (150 μm i.d., 15 cm in length and 1.5 μm particle size) using a gradient of increasing acetonitrile delivered by a Vanquish Neo UHPLC-system (Thermo Scientific) operating at a flow rate of 500nl min–1. Data acquisition was carried out on a Bruker timsTOF HT mass spectrometer using a diaPASEF mode of data acquisition. The dia-PASEF windows spanned a precursor range from 300 to 1,200 m/z using the following ion mobility parameters: 1/K0 start, 0.60 Vs cm−2; 1/K0 end, 1.60 Vs cm−2; ramp time, 100 ms; accumulation time, 50 ms.
LC–MS/MS analysis for ARL13B–BioID experiments was carried out on a Vanquish Neo UHPLC system coupled to an Astral mass spectrometer (Thermo Fisher Scientific). Peptide separation was performed using a trap-and-elute workflow on an ionopticks C18 reverse-phase column (8 cm × 150 µm, 1.7 µm particle size) maintained at 52 °C. Mobile phase A consisted of water containing 0.1% formic acid, whereas mobile phase B consisted of acetonitrile with 0.1% formic acid. A 15-min gradient was applied as follows: 5% B from 0 to 1 min (2.45 µl min–1); 5–15% B from 1 to 5 min (1.75 µl min–1); 15–25% B from 5 to 12.6 min (1.75 µl min–1); 25–38% B from 12.6 to 13.6 min (1.75 µl min–1); 38–80% B from 13.6 to 13.7 min (2.45 µl min–1); followed by a hold at 80% B for 15 min (2.45 µl min–1). Data-independent acquisition (DIA) was performed on an Orbitrap Astral mass spectrometer operating in positive electrospray ionization mode. MS1 spectra were acquired at 240,000 resolution across an m/z range of 380–980, with a normalized AGC target of 500% and a maximum injection time of 3 ms. DIA used sequential 4 m/z isolation windows covering a precursor range of 380–980 m/z. MS2 scans were acquired at 80,000 resolution using a normalized HCD collision energy of 25%, a normalized AGC target of 500% and a maximum injection time of 7 ms. For ARL13B proteomics, we had to use the cortex instead of the amygdala because the number of mice needed to perform the proteomic experiment (about 64) was prohibitive because of the small size of the amygdala. However, as there is limited information on the astrocyte primary cilium proteome, the cortex was a good place to start because astrocytes have ARL13B-positive primary cilia in the cortex and multidimensional scaling has shown that amygdala and cortical astrocytes cluster together at a molecular level.
The dia-PASEF files and the Thermo RAW files obtained after LC–MS/MS analysis were searched using DIA-NN (v.1.8.1) with an in silico library generated from a UniProt database containing all mouse proteins83. Statistical analysis of hits and DEPs was done using the Bioconductor package limma (v.3.60). A protein was declared a hit when it satisfied the following filters: log2[BioID2/GFP] > 1 and adjusted P < 0.05. GO pathway analysis was performed using Enrichr (https://maayanlab.cloud/Enrichr/). Putative localization in the primary cilium of high probability hits from proteomics was based on the following published work: TULP3 (ref. 84), ARL3 (ref. 85), IFT74 (ref. 86), TOGARAM1 (ref. 87), MAP4 (ref. 88), SNAP29 (ref. 89), RAB34 (ref. 90), EHD1 (ref. 89), DLG1 (ref. 91), EZR92, INPP5E93 and IFT43 (ref. 94).
Molecular cloning and PHP.eB AAV generation
To generate the ARL13B–BioID2 and GFP plasmids, the Astro-BioID2 (Addgene plasmid 176740) or Astro-GFP (Addgene plasmid 176861) plasmid was cut by restriction digestion at the XhoI site. cDNA for ARL13B was amplified from Addgene plasmid 232880 (ref. 95) and cloned into the XhoI site using In-fusion cloning (Takara Bio). The plasmids were packaged into PHP.eB AAVs in-house following a published protocol96.
Retroorbital delivery of PHP.eB AAVs
Brain-wide expression of ARL13B–BioID2 and ARL13B–GFP in astrocytes in 8-week-old mice was achieved by retro-orbital injection into the eye sinus with 1012 genome copies per mouse of AAV-PHP.eB-GfaABC1D-ARL13B-BioID2-HA or AAV-PHP.eB-GfaABC1D-ARL13B-GFP97. The biotin injections were performed as indicated above. The entire cortex was dissected and used for streptavidin-mediated pull-down of biotinylated proteins as indicated above. The plasmids are available from Addgene (identifiers 253927 and 253928).
CilioGenics probability
Data were downloaded98 from https://ciliogenics.com/?page=Home. Proteins were assigned a probability on the basis of the assigned CilioGenics score as per the website: high = 1, medium = 1–0.5, low < 0.5.
MACS-based astrocyte isolation and qPCR
The protocol was adapted from a previous study99. Amygdala tissue collected from 3–4 adult mice was homogenized together for each sample. The tissue was incubated in papain at 37 °C for 30 min with a constant supply of 95% O2 and 5% CO2 on the liquid surface, then centrifuged and resuspended in cold PBS, filtered through a 70 µm cell strainer and debris was removed with Debris Removal solution (130-109-398, Miltenyi Biotec) following the manufacturer’s instructions. The resulting supernatant was resuspended in 90 µl 0.5% BSA (A7030, Millipore Sigma) containing 1 mM EDTA (15575-020, Invitrogen) and incubated with 10 µl FcR blocking beads (130-097-678, Miltenyi Biotec) for 10 min at 4 °C, followed by the addition of 10 µl ACSA-2 beads and incubation for 15 min at 4 °C. Then, 2 ml BSA–EDTA was added, the solution was centrifuged, resuspended in BSA–EDTA and filtered through a MS column (130-042-201, Miltenyi Biotec) placed on a MACS magnet. The column was eluted with BSA–EDTA and RNA was isolated with a RNA extraction kit (Qiagen, 74034). cDNA was obtained from RNA with SuperScript IV (18090010, Invitrogen) following the manufacturer’s instructions. qPCR was performed with the following primers: Aldh1l1, Rbfox3 and Aif1 sequences have been previously described100; Slc1a3 fw 5′-GCGATTGGTCGCGGTGATAATG-3′; Slc1a3 rv 5′-CGACAATGACTGTCACGGTGTAC-3′; Mbp fw 5′-ATTCACCGAGAGGCTGGAA-3′; Mbp rv 5′-TGTGTGCTTGGAGTCTGTCACC-3′; Ppia fw 5′-CATACAGGTCCTGGCATCTTGTC-3′; and Ppia rv 5′-AGACCACATGCTTGCCATCCAG-3′. Gene expression was calculated as Ct values relative to the housekeeping gene Ppia in each fraction (astrocyte or input) and then plotted as the ratio of the Ct values of the two fractions.
Human amygdala astrocyte snRNA-seq analysis
Frozen amygdala tissue samples from 120 brain donors were obtained from the Harvard Brain Tissue Resource Center. Sets of 20 brain tissue specimens (each consisting of donors with PSDs and unaffected individuals) were processed at once as a single pooled sample, including nucleus extraction, generation of gel beads-in-emulsion and library preparation performed according to the 10x Chromium Single Nuclei 3′ v3.1 protocol. Raw sequencing reads were aligned to the hg38 reference genome using the standard Drop-seq (v.2.5.4) workflow. Reads were assigned to annotated genes if they mapped to exons or introns of those genes. Ambient or background RNA was removed from digital gene expression matrices using CellBender (v.0.3.0) remove-background. Dropulation (v.2.5.4) was used to assign each nucleus to its donor of origin on the basis of transcribed single-nucleotide polymorphisms. Cell-type assignment was accomplished with cell-classification models trained using scPred (v.1.9.2).
scRNA-seq data from astrocytes were pseudo-bulked by summing raw gene counts across all astrocyte cells (with ≥200 detected genes, to exclude low-quality nuclei) from each donor. Donors with fewer than 30 astrocytes were excluded, which resulted in 109 donors (71 with PSDs and 38 unaffected individuals; mean age 65.07 ± 17.21 years; n = 53 women). Differential expression analyses were performed in edgeR (v.4.2.1) using quasi-likelihood negative binomial regression with glmQLFit(), and testing was carried out with glmQLFTest() for the contrast between PSD and control donors. Normalization was conducted using the TMM method via calcNormFactors(), and lowly expressed genes were filtered with filterByExpr(). Age, sex and data collection batch were included as covariates in the design matrix, and multiple testing correction was performed using the Benjamini–Hochberg method to control the false discovery rate. We report the astrocyte data for the primary cilium-related genes here, but a follow-up study from the laboratory of S.A.M. will report all cell types of the amygdala in due course.
Statistical analysis and data presentation
Data from every experiment represent at least three replicates. Sample sizes were based on previous experiments using similar or identical experiments and the use of similar models by our laboratory. Statistical tests, unless otherwise stated, were run in OriginPro 2024. In bar plots, data are presented as the mean (bar) ± s.e.m. (error bars) along with the individual data points. The results of statistical comparisons, n numbers and significance levels are shown in the figure panels along with the average data. n is defined as the number of cells or mice on a case-by-case basis throughout the paper. We determined whether each set of data was normally distributed using OriginPro 2024. If the data were normally distributed, we used parametric tests; if they were not normally distributed, we used nonparametric tests. Unpaired Student’s two-tailed t-tests, two-tailed Mann–Whitney tests and one-way and two-way analysis of variance (ANOVA) tests were used for most statistical analyses comparing two groups. One-way ANOVA followed by Tukey’s post-hoc test or Kruskal–Wallis ANOVA followed by Dunn’s test were used for statistical analyses comparing three or more groups. Significance was declared at P < 0.05. When P values were greater than 0.05, they are stated as not significant. When the P value was less than 0.01, it is stated as <0.01. When the P value was less than 0.001, it is stated as <0.001. All transcriptomic and proteomic analyses used a statistical adjusted P < 0.05 unless otherwise stated. No data points were excluded from any experiment. Data used to generate the graphs shown in the figures are provided in the Source Data files. The results of all statistical tests are provided in Supplementary Table 1.
Reporting summary
Further information on research design is available in the Nature Portfolio Reporting Summary linked to this article.

