


Sleeping Beauty transgene overexpression
Bidirectional Sleeping Beauty plasmids encoding codon-optimized cDNA of the gene of interest (KIT) or its mutated variants were cloned downstream of an EF1α promoter. The same construct included a reporter cassette constituted by a fluorescent protein (mTagBFP2) and puromycin-acetyltransferase (PAC) separated by a P2A peptide downstream of an RPBSA chimeric promoter. dsDNA inserts used for cloning were synthesized by IDT (IDT gBlocks). Human (K562, HEK-293T) or mouse (NIH-3T3 or Ba/F3) cell lines were electroporated using Lonza 4D-Nucleofector system according to the manufacturer’s instructions with 500 ng pSB100x transposase plasmid (Addgene #34879) and 100 ng of the transfer plasmid, unless stated otherwise. Cells underwent puromycin selection (1–2 μg ml−1) starting 5 days after electroporation and analysed by flow cytometry 7–14 days after the start of the selection.
KIT mAbs
The SR-1 mAb (mouse IgG2a) was produced by BioXcell. The BA7.3 C.9 hybridoma line was purchased through ATCC and sent to BioXcell for mAb production and purification. SR-1 later became available as BioXcell InVivoMAb anti-human KIT (BE0380). Fab-79D was produced as recombinant mAb by Genescript using the TurboCHO service as human IgG1. A briquilimab research analogue sharing the publicly available sequence of briquilimab (record UNII QWX84D0DRC, DrugBank accession DB18136) was produced as an aglycosylated (N297Q) recombinant mAb by Genescript.
KIT degenerate codon library
We cloned a bidirectional Sleeping Beauty plasmid encoding for a codon-optimized human KIT cDNA bearing unique restriction sites flanking each ECD and a reporter cassette composed of mTagBFP2-P2A-puromycin N-acetyl-transferase (PAC). To introduce random amino acids, we generated a library insert by PCR amplification of 350 bp long pooled ssDNA oligos (IDT oPools), encoding the KIT ECD2 bearing degenerate bases (NNN) at each amino acid position, flanked by homology arms for the backbone plasmid. The gel-purified insert was then cloned into the Sleeping Beauty transfer by HiFi cloning (NEB E2621L) and plated on 10× 15 cm agar dishes to estimate library complexity by counting bacterial colonies. Electroporation of HEK-293T cells with low plasmid doses (50–250 ng per 100 μl electroporation volume) allowed to select cells transduced with (~5–10%) efficiency and obtain approximately 1 integration per cell. Sorting of cells positive for KIT control antibody (104D2 clone) and negative for therapeutic SR-1 clone and cells positive for both antibodies was carried out using a BD Melody or BD FACS Aria sorter. Genomic DNA (gDNA) of sorted fractions was extracted (Qiagen DNAeasy Blood&Tissue Kit, 69504) and the library region was amplified by PCR with primers bearing Illumina partial adapters for NGS sequencing (Genewiz Amplicon EZ, Azenta Life Sciences).
Fluorescent ligand binding assay
hSCF (Peprotech 300-07) was resuspended at 1 mg ml−1 and conjugated with AlexaFluor-488 or AlexaFluor-647 (Invitrogen AF488 or AF647 Antibody Labeling Kit, A20181 and A20186) for 1 h at room temperature. The reaction was quenched with 1% 1 M Tris-HCl pH 8. Cell lines transduced with the respective KIT variant by Sleeping Beauty transposase were incubated in the presence of AF488-conjugated SCF for 15 min at room temperature, washed with PBS + 2% FBS and analysed by flow cytometry. The data obtained from the antibody and ligand affinity assays at different concentrations were analysed using Graphpad Prism v10.5.
Base editing and prime editing of cell lines
Human K562 cells were cultured in IMDM supplemented with 10% fetal bovine serum (FBS), 1% penicillin-streptomycin (10,000 U ml−1), 2% l-glutamine (200 mM). For base-editing and prime-editing experiments, K562 cells were collected and resuspended in electroporation solution59 supplemented with 500 ng base editor plasmid and 150-360 pmol of sgRNA (IDT) in a 20 μl electroporation volume. Cells were electroporated using Lonza 4D-Nucleofector system (FF-120 pulse) and cultured for 72 h before evaluation by flow cytometry or gDNA collection.
Base editing and prime editing evaluation by Sanger sequencing
gDNA was extracted using DNeasy Blood & Tissue Kit (Qiagen no. 69506) or QuickExtract solution (Lucigen, QE0905T). PCR amplification of the 350–600 bp region surrounding the target residue was performed using GoTaq G2 polymerase (Promega, M7848) and purified using SV-Wizard PCR Clean-Up kit (Promega, A9282) or sparQ PureMag magnetic beads (QuantaBio, 95196-060). Sanger sequencing was performed through Genewiz (Azenta Life Sciences). Base editing outcomes were estimated using editR v1.08 R package60 for both base editing and prime editing, as the intended edits accounted for single base substitutions with no indels.
In vitro antibody-mediated selection assays
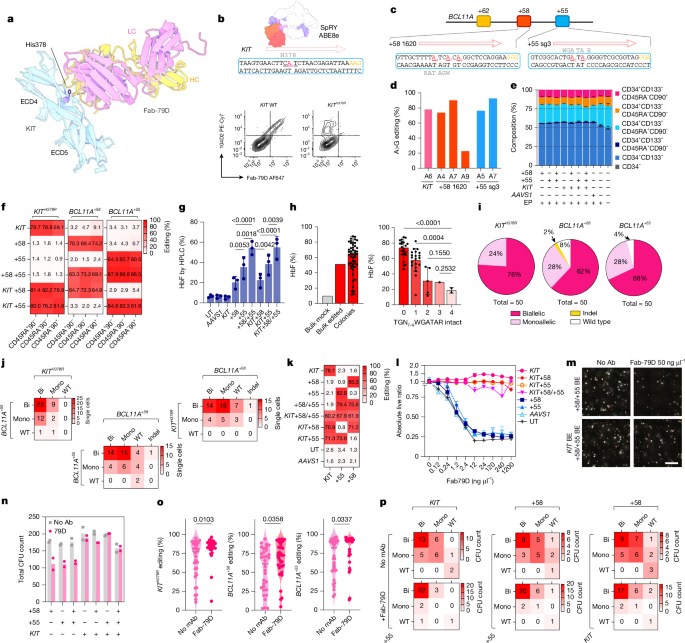
Human stem cells (mobilized peripheral blood-derived CD34+ HSPCs, either unmodified or edited for KIT) were plated in flat-bottom 96-well plates, with 10,000-15,000 cells per well in StemCell SFEMII medium supplemented with 100 ng ml−1 human SCF (Peprotech). SR-1 or Fab-79D anti-KIT mAbs were then diluted to the indicated concentrations in SFEMII medium and then added to the cultured cells, with technical quadruplicates. The plates were incubated at 37 °C in a humidified incubator with 5% CO2 for 3 days (early time point) or 7 days (late time point). For analysis, cells were transferred to V-bottom plates supplemented with 10–15 μl Countbeads (Biolegend 424902), centrifuged and resuspended in staining mix, containing human Fc-blocking reagent (Miltenyi 130-059-901) and anti-CD34-BV421, CD133-PE, CD90 APC and CD45RA APC-Cy7 mAbs (Biolegend; see Supplementary Table 3). After incubation at room temperature for 15 min, the cells were washed and resuspended in AnnexinV binding buffer (Biolegend 422201) containing AnnexinV FITC or Pacific Blue (Biolegend 640945 or 640918) and 7-AAD. Plates were analysed using a BD Fortessa high-throughput system (HTS) and acquired with BD FACS Diva software v6. Absolute counts of live (AnnV-7-AAD-) target cells were calculated using CountBeads and normalized on the no-antibody condition (absolute count of cells divided by the median of the cells in the no-antibody replicates).
Base editor mRNA in vitro transcription
Base editor or prime editor mRNA was prepared by T7 run-off in vitro transcription (IVT) using a custom plasmid template encoding for a T7 promoter, a minimal 5′ UTR, the base editor reading frame, 2× HBB 3′ UTR and a 110-120-bp poly-A sequence61. The plasmid template was linearized by BbsI-HF restriction digestion (NEB, R3539) and purified by phenol-chloroform extraction (Sigma Aldrich, P2069). mRNA IVT was performed using NEB HiScribe T7 kit (E2040S) and co-transcriptionally capped with ARCA (3′-O-Me-m7G(5′)ppp(5′)G RNA cap analogue, NEB S1411L) or CleanCap AG (Trilink N-7113). Partial (75%) or total UTP substitution with N1-methyl-pseudo-UTP (Trilink N-1103) or 5-methoxy-UTP (Trilink N-1093) was performed as indicated. DNAse treatment (NEB M0303L) was added after IVT reaction (30 min at 37 °C). IVT mRNA was purified using NEB Monarch RNA Cleanup kit (T2050L) and resuspended in RNase-free water. mRNA was quantified using a Nanodrop-8000 Spectrophotometer and quality control was performed using Agilent Fragment Analyzer with RNA Kit-15NT (Agilent DNF-471). For Vpx mRNA, we used a template containing a 5′ UTR composed of an eIF4G aptamer, a Kozak sequence, the Vpx cassette, and a 3′ UTR constituted by the Woodchuck Hepatitis Virus Post-transcriptional Regulatory Element (WPRE) sequence. This template was prepared by PCR using a forward primer to correct a T7 promoter inactivating mutation and a reverse primer to append a 119-nt poly(A) tail to the 3′ UTR.
CD34+ base editing and prime editing
Cryopreserved human CD34+ HSPCs from mobilized peripheral blood of eight deidentified healthy donors were obtained from the Fred Hutch Cooperative Center of Excellence in Hematology (U54 DK106829). Plerixafor-mobilized peripheral blood from patients with SCD was procured after Boston Children’s Hospital institutional review board (IRB) approval and patient-informed consent. CD34+ HSPCs were isolated using the CliniMACS CD34 reagent (Miltenyi, 130-017-501) and CliniMACS LS tubing set (Miltenyi, 170-076-651). CD34+ HSPCs were thawed, cultured, and electroporated as previously described36. In brief, cryopreserved cells were thawed in RPMI + 20% FBS and cultured in StemSpan SFEMII medium (StemCell 09655) supplemented with 1% penicillin-streptomycin (10,000 U ml−1), 1% l-glutamine (200 mM), 150 ng ml−1 hSCF (Peprotech 300-07), 150 ng ml−1 hFLT3L (Peprotech 300-19), 75 ng ml−1 hTPO (Peprotech 300-18), 0.75 mM StemRegenin-1 (StemCell 72344), 35 nM UM171 (Sellekchem, S7608), unless stated otherwise. For experiments comparing SFEMII versus X-VIVO15 medium (Lonza 02-060Q) for prime editing, supplements, and concentrations are reported in Extended Data Fig. 4d. Cells were collected and electroporated using Lonza 4D-Nucleofector system 24 h (for prime editing) or 48 h (for base editing) after thawing. Cells were resuspended in P3 solution (Lonza V4XP-3024) supplemented with 60–240 nM base editor or prime editor mRNA, 10–20 μM sgRNA or pegRNA (IDT) and 1.2 U ml−1 RNAse inhibitor (Promega RNAsin Plus, N2611). In PE3 experiments, the nicking guide(s) was added at half the concentration of the pegRNA. We used electroporation pulse EO100 or CA-137 for base editing (see Extended Data Fig. 1b), and DS-130 for prime editing (see Extended Data Fig. 4c). For in vivo experiments, cells were counted and transplanted 24 h after the electroporation or, for in vitro experiments, cultured for an additional 5–7 days in the same medium described above at a density of 0.5 million per ml.
In vitro erythroid differentiation
Bone marrow cells collected from humanized mice or cultured CD34+ HSPCs were transferred into erythroid differentiation medium (EDM) consisting of IMDM (GibcoTM, 12440061) supplemented with 330 μg ml−1 holo-human transferrin (Sigma, T0665-1G), 10 μg ml−1 recombinant human insulin (Sigma, 19278-5 ML), 2 IU ml−1 heparin (Sigma, 19278-5 ML), 5% human solvent detergent pooled plasma AB (Rhode Island Blood Center), 3 IU ml−1 erythropoietin (Amgen, 55513-144-10). During days 0-7 of culture in EDM-1, EDM was further supplemented with 10-6 M hydrocortisone (Sigma Aldrich, H0135), 100 ng ml−1 human SCF (CellGenix, 1418-050) and 5 ng ml−1 of recombinant human IL-3 (Peprotech, 200-03). During days 7-11 of culture in EDM-2, EDM was supplemented with 100 ng ml−1 human SCF (CellGenix, 1418-050). During days 11-18 of culture in EDM-3, EDM had no additional supplements. Differentiated cells were then used for experimental readouts.
Haemoglobin HPLC
Haemolysates were prepared from erythroid cells after 18 days of erythroid differentiation using Hemolysate reagent (Helena Laboratories 5125) and analysed with D-10 Hemoglobin Analyzer (Bio-Rad) according to the manufacturer’s recommendations.
Genotyping and haemoglobin measurement of single-cell-derived erythroid colonies
Single cells derived from human CD34+ HSPCs were FACS-sorted 24 h after editing. The cells were sorted by BCL2-ARIA II SPEC (BD Biosciences) into 150 μl of EDM-1 (see in vitro erythroid differentiation) in 96-well round-bottom plates (ThermoFisher Scientific, 3799) at one cell per well. After 7 days of EDM-1 culture, if colonies were visible at the round bottom of plates, the medium was exchanged to 300 μl of EDM-2. After an additional 4 days of EDM-2 culture, half of the cells were kept in 500 μl of EDM-2, while half of the cells were passaged into 300 μl of EDM-3. After an additional 7 days of EDM-3 culture, cells in EDM-2 were used for genotyping analysis, whereas cells in EDM-3 were used for haemoglobin HPLC measurement.
Fluorescent barcoded library preparation
To generate fluorescently labelled barcoded lentivirus libraries, we cloned a hPGK-mNeonGreen or hPGK-mTagBFP cassette followed by an SV40 polyadenylation signal into a third generation lentivirus backbone in antisense direction. We placed MluI and XbaI unique restriction sites in the 3′ UTR region just downstream of the fluorescent protein stop codon to enable cloning of the barcoded oligo. A 125–127 bp long Ultramer (IDT) with appropriate homology regions and containing 7 stretches of 4 degenerate bases (NNNN, for a total of 28 N), separated by constant anchors, was directly used for cloning through NEB HiFI Assembly. Plating into 15-cm LB-Agar dishes enabled colony screening to ensure product purity and estimation of library complexity, with a minimum goal of 100,000 bacterial colonies. Recovery of the bacteria into liquid LB medium and a short (3 h) growth at 37 °C enabled the extraction of sufficient plasmid material for downstream steps (Macherey-Nagel NucleoBond Xtra Maxi Plus EF 740426.50). Lentiviral production was performed by Calcium-Phosphate transient transfection of the packaging and transfer plasmids (pMDL-RRE, pREV, pMD2, pAdvantage) into HEK-293T cells growing at ~70% confluency. Medium was exchanged 12 h after transfection and, after 30 h since medium change, the culture supernatant was collected, filtered through a 0.22-μm filter and ultracentrifuged at ~72,000g, for 2 h at 20 °C using a Beckman Optima L-90K centrifuge to achieve 500× concentration. Viral preps were titrated by serial dilution on HEK-293T cells and transduced cells analysed by flow after 7–14 days to calculate functional titre (TU ml−1). Lentiviral transduction of primary mobilized peripheral blood-derived CD34+ HSPCs was performed after overnight culture (12–24 h after thawing) at multiplicity of infection = 30 in the presence of 8 μM Cyclosporine H (Sigma) as transducer enhancer to achieve >70–80% transduction. In experiments where CD34+ HSPCs are both transduced and base-edited or prime-edited, cells were electroporated 24 h after lentivirus transduction.
In vivo xeno-transplantation experiments
All animal experiments were performed in accordance with regulations set by the American Association for Laboratory Animal Science and Institutional Animal Care and Use Committee (IACUC) approved protocol (DFCI#21-002). Mice were housed in specific pathogen–free facility (temperature 20–24 °C; relative humidity 30–70%) with sterile individually ventilated cages and fed autoclaved food and water, with a standard 12 h day/night light cycle. Six- to eight-week-old female62 NOD.Cg-KitW-41J Tyr+ Prkdcscid Il2rgtm1Wjl/ThomJ mice (NBSGW, Jackson Laboratories, 026622) were xeno-transplanted with 1 million human CD34+ HSPCs per mouse by tail vein injection. Human engraftment was monitored by peripheral blood flow analysis at 7–9 weeks. Anti-KIT/CD117 mAbs were administered to NBSGW mice by intravenous or intraperitoneal injection at the indicated intervals and for the indicated number of doses. Unless otherwise specified, doses are reported as absolute mass (mg) per mouse; approximate mg kg−1 equivalents were additionally calculated using an average adult female NBSGW body weight of ~25 g (0.025 kg) to facilitate cross-study comparison. Cumulative antibody exposure for each regimen was defined as the sum of all administered doses. Antibodies were diluted in sterile vehicle (PBS) and injected in a constant volume per dose (0.2 ml); control groups received matched vehicle. At the end of the experiment, bone marrow (hind limbs and sternum), spleen, and peripheral blood were collected for FACS and genomic analyses. To evaluate editing efficiency within different haematopoietic subsets, ~20% of total bone marrow cells were FACS-sorted to isolate haematopoietic lineages (CD33+ myeloid, CD19+ lymphoid, and CD33−CD19−CD34+ progenitors), then used for gDNA extraction. Secondary transplantation was performed by transplanting total bone marrow from primary recipients into a second cohort of NBSGW mice. Bone marrow cells were administered intravenously either as freshly prepared single-cell suspensions or after thawing from viable cryopreserved bone marrow samples. Each secondary recipient received ~25% of the total bone marrow cells obtained from a single primary donor mouse. Mice were monitored by peripheral blood analysis to confirm human engraftment and euthanized after 16–18 weeks.
Colony-forming assays
CFU assays were performed by plating 1,000 CD34+ cells per well, for in vitro CD34+ HSPCs experiments, or 25,000 total bone marrow cells per well for xeno-transplanted bone marrow-derived assays, unless stated otherwise. Cells were resuspended in Methocult H4034 medium (StemCell 04034) and plated in SmartDish meniscus-free six-well plates. Wells were imaged and analysed after 2 weeks using StemCell STEMvision system and STEMvision software using the 14-day bone marrow setting. For flow cytometry analysis, methylcellulose medium was softened with pre-warmed PBS, collected, and washed twice before analysis. Myeloid and erythroid cell discrimination was achieved by staining for CD33 and CD71, respectively, while mNG and mtBFP detection enabled the identification of the edited versus non-edited cell of origin.
Myeloid differentiation culture and phosphoflow analysis of HSPCs
CD34+ HSPCs derived from three different healthy donors were thawed, cultured in HSC expansion medium and edited as previously described. Five days after electroporation, cells were transitioned to myeloid differentiation medium (SFEMII, penicillin-streptomycin 1%, Q 1%, SCF 100 ng ml−1, FLT3L 100 ng ml−1, TPO 50 ng ml−1, GM-CSF 100 n l−1, IL-6 50 ng ml−1, and IL-3 10 ng ml−1 (Peprotech)). After 5 days, cells were starved overnight in SFEMII (not supplemented with cytokines) and then stimulated with SCF 100 ng ml−1, G-CSF 100 ng ml−1, IFNβ 5,000 U ml−1, IFNγ 10 ng ml−1, IL-4 50 ng ml−1, PMA 100 ng ml−1 plus Ionomycin 1 μg ml−1 or LPS 100 ng ml−1 for 20 min at 37 °C. Cells were then collected and immediately fixed with Biolegend fixation buffer (420801) and permeabilized with Biolegend TruePhos Perm Buffer (425401) according to the manufacturer’s instructions. Cells were then aliquoted into two fractions and stained with the following antibody mixes: (1) pSTAT1 PE-Cy7, pSTAT3 BV421, pSTAT5 PE, pSTAT6 AF647 and pAKT AF488; (2) pERK1/2 BV421, pMEK1 AF647, p38/MAPK PE and pRPS6 PE-Cy7 (Biolegend). Cells were then analysed on a BD Fortessa Analyzer with HTS sampler.
Gene expression analysis of edited CD34+ HSPCs
RNA-seq gene expression analysis was performed using Plasmidsaurus Nanopore RNA-seq platform. n = 32 samples from CD34+ cells isolated from three donors (donors 1, 2 and 3), corresponding to combinations of editing locus (BCL11A, KIT or AAVS1), prime editing strategy (PE2 and/or PE3), and SCF stimulation conditions (unstimulated versus stimulated) were sequenced. Raw fastq files underwent quality assessment using FastQC v0.12.1, followed by quality filtering with fastp v0.24.0 (poly-X tail trimming, 3′ quality-based tail trimming, minimum Phred score of 15, minimum length 50 bp). Quality-filtered reads were aligned to the human reference genome hg38 using STAR v2.7.11 with non-canonical splice junction removal and unmapped read output, followed by coordinates sorting with samtools v1.22.1. PCR and optical duplicates were removed using unique molecular identifier (UMI)-based deduplication (UMIcollapse v1.1.0). Alignment quality, strand specificity, and read distribution were evaluated using RSeQC v5.0.4 and Qualimap v2.3, aggregated into a MultiQC v1.32 report. Gene-level quantification was performed using featureCounts (subread v2.1.1) with strand-specific counting, multi-mapping fractional assignment, and grouping by gene_id. Differential expression analysis was performed in Python using the PyDESeq2 (Love et al., 2014, adapted for Python) implementation of the DESeq2 negative binomial model. Gene-level counts for all retained genes were modelled with the following design formula for the full model:
$$\textGeneExpr\,=\,\beta _+\beta _\rmd\rmo\rmn\rmo\rmr+\beta _\rms\rmt\rmi\rmm\rmu\rml\rma\rmt\rmi\rmo\rmn+\beta _\rmg\rmu\rmi\rmd\rme+\beta _\rmp\rmr\rmi\rmm\rme\text-\rme\rmd\rmi\rmt\rmo\rmr$$
with reference levels set to donor-unspecified, unstimulated (unstim), AAVS1 guide and PE2 prime editor. In this model, β0 represents the gene-specific intercept corresponding to the reference condition, while βdonor, βstimulation, βguide and βprime-editor represent gene-specific coefficients for donor, stimulation status, guide/editing locus and prime-editing system, respectively. Donor, guide and prime-editor terms were treated as categorical covariates using reference-level coding. The stimulation coefficient βstimulation was used to test the adjusted main effect of SCF stimulation across donors, guides and prime-editing systems. Model coefficients were tested using the Wald test with Benjamini–Hochberg correction for false discovery rate (FDR) correction. The primary contrast tested was the main effect of stimulation (stimulated versus unstimulated) across all donors, guides, and editing systems, representing the global stimulus response while controlling donor, guide, and prime editing effects. Significant genes were identified using thresholds of adjusted P value < 0.001 with |log2 fold change| > 1.0 (moderate). Heat maps of z-score normalized expression for high-confidence differentially expressed genes (adjusted P < 0.05, |log2FC| > 1.5) were generated using hierarchical clustering (Euclidean distance, Ward linkage) with sample annotations for stimulation, guide, prime editing, and donor, visualized using seaborn clustermap. Figures were generated using matplotlib, seaborn.
Flow cytometry
Cell lines were collected, washed in PBS + 2% FBS, resuspended in 100 ml, incubated with human or mouse Fc-blocking reagent (Miltenyi 130-059-901 and 130-092-575) and then stained with the indicated antibodies for 20-30 min at 4 °C and washed. Viability was assessed by LiveDead yellow (Invitrogen L34959), 7-AAD (Biolegend 420404), or propidium iodide (PI, Biolegend, 421301) staining. Immunophenotyping of in vitro base-edited CD34+ HSPCs was evaluated by staining for 30 min at 4 °C with CD34 BV421, CD45RA APC-Cy7, CD90 APC, and CD133 PE antibodies after incubation with Fc-blocking reagent (Miltenyi 130-059-901). Viability was assessed by 7-AAD or propidium iodide (PI) staining. Peripheral blood collected from in vivo experiments was lysed twice for 10 min at room temperature twice using ACK reagent (StemCell 07850), washed, incubated with human and mouse Fc-blocking reagent (Miltenyi 130-059-901 and 130-092-575) and stained at room temperature for 15 min with hCD45 BV421 or BV786, mCD45 PE, CD3 AF647, CD19 BV605, CD33 PE-Cy7 antibodies, unless stated otherwise. 7-AAD was included as viability stain. To comprehensively identify haematopoietic populations in bone marrow samples63, collected cells were lysed using ACK reagent, washed twice and supplemented with CountBeads (50–100 μl per tube) for absolute cell number quantification. Samples were then incubated with human and mouse Fc-blocking reagent and stained for 30 min on ice with hCD45 BV786, mCD45 PerCP-Cy5.5, CD3 PE-Cy5, CD7 AF700, CD10 BUV737, CD11c BUV661, CD14 BV510, CD19 BV605, CD33 PE-Cy7, CD38 BUV396, CD45RA APC-Cy7, CD34 BUV496, CD90 APC, FLT3 PE and KIT 104D2 BV711 antibodies (Supplementary Table 3), with the addition of 50 ml per sample Brilliant Stain buffer (BD 659611). In some experiments, a KIT dual staining with SR-1 AF488 and 104D2 BV711 was performed to directly visualize editing status. Cells were acquired on a five-laser BD Fortessa flow cytometer using BD FACS Diva software v6 and analysed using FCS Express 7 (DeNovo Software).
Bioinformatic processing of epitope mapping libraries
Amplicon sequencing data were first processed to merge raw paired-end reads into single consensus sequences using BBMerge, which corrects discrepancies between forward (R1) and reverse (R2) reads. The merged reads were aligned to a DNA reference corresponding to the section of wild-type (WT) KIT sequence undergoing screening using the BWA-MEM algorithm. Only high-confidence alignments were retained by filtering for a mapping quality score (MAPQ) greater than 60, and unmapped or low-quality reads were discarded. High-quality mapped reads were translated into amino acid sequences using the Biopython library. These translated sequences were then compared to the wild-type KIT protein (120 amino acids in length) using BLASTP. The BLASTP output was generated in tabular format (outfmt 6) to report alignment features including query ID, sequence length, per cent identity, number of mismatches, and aligned regions for both query and subject sequences. For each query, the best alignment was selected based on alignment length. Only sequences with an alignment length greater than 110 amino acids were retained to allow flexibility at the read extremities while ensuring coverage of the epitope region. Input sequences containing amino acid insertions relative to the reference were excluded from further analysis. From the filtered BLASTP results, we generated a data matrix for each sample with 22 rows representing the 20 canonical amino acids, the stop codon, and deletions, and 120 columns corresponding to each position in the wild type sequence. Each cell in the matrix records the number of reads in which a given amino acid was observed at a specific position, allowing quantitative profiling of epitope mutation frequency across the entire sequence. The frequency matrices corresponding to single-positive samples (characterized by abrogated binding affinity to the SR-1 antibody) and double-positive samples (with conserved SR-1 binding) were modelled using logistic regression for count data. Specifically, the number of reads carrying a specific mutation over the total number of reads in a sample was modelled to estimate whether significant enrichment of particular mutations was observed in single-positive samples. Statistical significance was assessed using a likelihood ratio test comparing two nested models. As a measure of enrichment or depletion, we used the chi-squared test statistic. A positive value indicates that a mutation is enriched in single-positive samples relative to double-positive samples, while a negative value indicates depletion. P-values associated with mutation enrichment were adjusted for multiple testing using the FDR, and mutations with FDR-adjusted P values below 0.05 were considered statistically significant.
Barcode-based clonal tracking of edited HSPCs
To evaluate the clonal architecture of edited haematopoietic populations, barcode libraries were amplified from gDNA extracted from sorted bone marrow fractions, including CD33+ myeloid, CD19+ lymphoid and Lin−CD34+ progenitor cells. Libraries were generated using a two-step PCR strategy. In PCR1, library-specific primers targeting the mNG or mtBFP constructs were used to amplify barcode-containing regions (Supplementary Table 2). The forward primer contained a seven-nucleotide degenerate sequence, which served as a UMI to account for PCR amplification bias and enable identification of PCR duplicates. In PCR2, common primers incorporating partial Illumina adapter sequences were used to generate sequencing-ready libraries (Supplementary Table 2). Following amplification, purified PCR products derived from the mNG and mtBFP libraries were pooled for Illumina amplicon sequencing (Amplicon EZ, Azenta). Sequencing reads were first quality filtered using Flexbar (v3.5.0) with a minimum quality threshold of qt = 30, using parameters q = TAIL and qf = i1.8. Only reads passing these criteria were retained for downstream analysis. High-quality reads were processed to detect and annotate the 7-nt UMI embedded in the forward primer using Flexbar (-at LEFT –adapter-trimmed-out ONLY -m 1). UMIs were used for PCR duplicate removal, and the maximum permissible error rate for UMI detection was set to 0.1. A 6-nt unique sequence embedded in the library design was used to assign fluorescence identity (mNG or mtBFP) to each read. Reads were further processed to identify the 28-nucleotide lineage barcode, corresponding to the designed barcode structure NNNNTGNNNNCANNNNACNNNNGANNNNGTANNNNAGCNNNN. Only reads with consistent fluorescence assignments and valid UMI or barcode annotation were retained and exported as text files for downstream processing using custom Python scripts. To reduce artificial inflation of barcode counts arising from sequencing or PCR artefacts, barcode sequences were clustered using the DBSCAN (density-based spatial clustering of applications with noise) algorithm, using Levenshtein distance as a similarity metric with a distance threshold of eight nucleotides (Extended Data Fig. 2j and Supplementary Fig. 1). This approach groups highly similar barcode sequences into unified clusters representing the same clonal lineage, improving the robustness of clonal assignments. Additionally, singleton UMIs (UMIs supported by a single read) were removed to reduce the impact of residual sequencing noise. Clone size was estimated using both total read counts and the number of distinct UMIs associated with each barcode. From these values, clonal diversity metrics were calculated, including species richness (S), the Shannon diversity index (H), Simpson’s diversity index (Simp), and Pielou’s evenness index (J), enabling quantitative characterization of clonal composition and distribution within each sample.
CHANGE-seq
CHANGE-seq was performed for prime-editing targets as previously described64. In brief, the purified gDNA tagmented using custom Tn5-transposome to an average length of 400–800 bp, and gap repaired with HiFi HotStart Uracil+ Ready Mix (Kapa Biosystems KR0413). USER enzyme (NEB M5505L) and T4 polynucleotide was then used to treat the gap-repaired DNA. DNA circularization was performed using T4 DNA ligase (NEB M0202L) and residual traces of linear DNA were removed by exonuclease cocktail and followed by dephosphorylation with Quick CIP (NEB M0525L). In vitro cleavage reactions were performed with 125 ng of circularized DNA, 90 nM SpCas9 protein (NEB), NEB buffer 3.1 (NEB), and 270 nM gRNAs in a 50 μl volume. Cleaved products were incubated with proteinase K (NEB), A-tailed, hairpin adapter (NEB) ligated, and treated with USER enzyme. Products were amplified by PCR with the Kapa HiFi polymerase (Kapa Biosystems), and libraries were quantified by qPCR (Kapa Biosystems) and sequenced on the Illumina NextSeq 2000 with the following cycles 151-8-8-151. CHANGE-seq data analyses were performed using open-source software https://github.com/tsailabSJ/changeseq. Plots representing top nominated sites for each gRNA are reported as Supplementary Figs. 2–5.
CHANGE-seq-BE
CHANGE-seq-BE was performed as previously reported44 using the same circularized, exonuclease cocktail, and CIP treated gDNA as mentioned above from CHANGE-seq. In brief, ABE in vitro deamination performed in a 50-µl reaction with deamination buffer (50 mM Tris-HCl pH 8.0, 25 mM KCl, 2.5 mM MgSO4, 0.1 mM EDTA, 10% glycerol, 2 mM DTT and 10 µM ZnCl2). ABE and gRNAs final concentrations were 300 nM and 900 nM with 125 ng of circularized DNA. ABE8e-deaminated DNA products were treated with proteinase K (NEB), followed by Endonuclease V (NEB, M0305S) treatment. Linearized DNA fragments were treated with Klenow fragment (3′→5′ exo-, NEB M0212L), dA-tailed, ligated with a hairpin adaptor (NEB), USER treated and amplified by PCR using HiFi HotStart Uracil (Kapa/Roche). Completed libraries were quantified by qPCR using the Kapa library quantification kit and sequenced with 151-bp paired-end reads on an Illumina NextSeq 2000. CHANGE-seq-BE data analyses were performed using open-source software https://github.com/tsailabSJ/changeseq/tree/BE. Plots representing top nominated sites for each gRNA are reported as Supplementary Figs. 2–5.
rhAmpSeq and analysis of off-target base editing and prime editing
Multiplex targeted sequencing (rhAmpSeq, IDT) performed on gDNA extracted from base- or prime- edited CD34+ cells and unedited controls to validate off-target activity from CRISPOR65, CHANGE-seq, and CHANGE-seq-BE designated sites. Libraries prepared and sequenced with 151-bp paired-end reads on an Illumina NextSeq 2000 according to the manufacturer’s protocol. Data was analysed using CRISPResso Pooled (v2.0.41). For base-editing analysis, the parameters were –quantification_window_size 10 –quantification_window_center -10. The percentage of reads containing A-to-G mutations within the protospacer positions 1–10 at on- or off-target sites was used for statistical analysis44. For prime editing analysis, the parameters were –quantification_window_size 1 –quantification_window_center -3. For pegRNA off-target analysis, the percentage of substitution that could be encoded by the RTT sequence and the percentage of indels at on- or off-target sites were used for statistical analysis. For nicking sgRNA off-target analysis, only the percentage of indels was used66. For the statistical analysis, chi-squared test was performed and false discovery rate (FDR) calculation using the Benjamini–Hochberg method. The reported off-target sites with difference ≥ 0.5% for at least one treatment and with FDR ≤ 0.05 were determined as significant. Custom code was used to conduct base-editing off-target quantification is available from GitHub https://github.com/tsailabSJ/MKSR_off_targets and https://github.com/YichaoOU/PE_off_target.
Uni-directional targeted sequencing
A custom Tn5-transposome with the full-length Illumina forward (i5) adapter, a sample barcode, and unique molecule identifier was used for the gDNA tagmentation. After tagmentation of the gDNA to approximately 1,500 bp fragments, 2 rounds of PCR were performed. The first PCR amplified the target site using the gene-specific anchor primer, and the second round of PCR added the reverse (i7) Illumina adapter with an additional sample barcode. Sequences of oligos and PCR components are provided in Supplementary Table 10. Both PCR1 and PCR2 conditions were as follows: denaturation, 95 °C for 5 min; touchdown (15× cycles), 95 °C, 70 °C, 72 °C for 0.5 min, 2:00 (1 °C per cycle), 0.5 min; amplification (12× cycles), 95 °C, 55 °C, 72 °C for 0.5 min, 1:00, 0.5 min (at 1.2 °C s−1 ramp rate); extension 72 °C for 5 min; hold 4 °C. Final libraries were then quantified by qPCR, pooled, and size-selected for 400–850 bp using Yourgene Health LightBench, and then sequenced on an Illumina NextSeq 2000 with 301-8-18-301 cycles. Analysis was performed as previously reported67. Source code available at https://github.com/editasmedicine/uditas. UDiTaS was run with parameters -window_size 10 -min_MAPQ 10.
Qualitative junction PCR and ddPCR quantification of prime editing-induced translocations
To detect potential inter-chromosomal rearrangements between the KIT and BCL11A sites, a panel of cross-chromosomal PCR primer pairs was designed to flank the edited regions of both loci (Supplementary Table 2). The positive strand was defined as the strand with the 5′ end at the short (p) arm terminus, and primers were designated as forward or reverse according to each gene’s open reading frame orientation. Two amplicon sizes were evaluated (~400 bp, ~900 bp) to enable orientation-specific detection of reciprocal and non-reciprocal junctions. Primer performance was validated on-target (Promega GoTaq G2 MasterMix), with short amplicons demonstrating superior amplification efficiency and specificity on both loci. We used K562 edited with SpCas9 nuclease and different combinations of KIT and BCL11A pegRNAs and nicking gRNAs to generate positive controls for chromosomal translocations. Annealing temperature for all primer combinations was optimized within the range identified for on-target amplicons (60–67 °C), and 65 °C was selected based on specificity versus unedited controls. Thermal cycling was performed as follows: initial denaturation at 95 °C for 2 min; 35 cycles of 95 °C for 30 s, 65 °C for 30 s, and 72 °C for 45 s; followed by a final extension at 72 °C for 5 min. Amplification products were resolved by agarose gel electrophoresis (1.5–2% agarose in TAE buffer) and visualized by SYBR-based staining. To enable absolute quantification of translocation frequency, ddPCR assays targeting KIT–BCL11A junctions were developed. FAM-fluorescent probes (IDT) were designed for each short-amplicon primer pair (Supplementary Table 2) and tested for on-target and cross-chromosomal amplicon detection, using both gDNA from nuclease-treated cells and spike-in of the gel-purified translocation products generated in the PCR optimization described above. A genomic control locus (TTC5 gene) was used as normalizer (with HEX as fluorophore). ddPCR reactions were prepared according to the manufacturer’s recommendations (Bio-Rad QX200 ddPCR system) using ddPCR Supermix no dUTP for probes (Bio-Rad) using 50 ng input gDNA per reaction, with 4 replicate wells per sample (200 ng total input) to maximize assay sensitivity. Thermal cycling was performed for 40 cycles as follows: 95 °C for 3 min; 95 °C for 30 s, 59 °C for 30 s (ramp rate 2 °C s−1), and 72 °C for 1 min; followed by a final extension at 72 °C for 5 min and a 4 °C hold. Droplets were generated using the QX200 Droplet Generator (Bio-Rad) according to the manufacturer’s instructions. Data were analysed with QuantaSoft Manager software (Bio-Rad). Positive and negative droplet thresholds were defined based on no-template and unedited genomic controls. Translocation frequencies were calculated as copy number normalized to reference gene copies (n = 2) and reported as events per 1,000 diploid genomes.
Statistical analyses
The n indicates the number of biologically independent samples, animals, or experiments. Data are summarized as mean ± s.d. Inferential techniques were applied in presence of adequate sample sizes (n ≥ 5), otherwise only descriptive statistics are reported. Comparisons between two groups are performed by unpaired t-test. FDR-adjusted P values are reported when appropriate. When one variable is compared among more than two groups, one-way ANOVA is used. When multiple variables are compared among more than two groups, two-way ANOVA is used. The P value of the row or column effect is reported as appropriate to describe the significance of the selected parameter on the measured variable. Multiple comparisons between groups are performed with two-stage step-up procedure of Benjamini, Krieger and Yekutieli to control the false discovery rate (FDR, Q = 0.05), when appropriate. When dose–response relationships were compared across experimental groups, data were fit by global nonlinear regression using a four-parameter logistic (Hill) model. Differences in HillSlope were evaluated by comparing a constrained model with a shared HillSlope to an unconstrained model allowing group-specific HillSlope values using an extra sum-of-squares F-test (nested model comparison; α = 0.05). In all the analyses, the significance threshold was set at 0.05, and ‘NS’ means not significant. Data were collected in Microsoft Excel, and statistical analyses were performed in GraphPad Prism v10.5 (GraphPad).
Reporting summary
Further information on research design is available in the Nature Portfolio Reporting Summary linked to this article.

