


Sample preparation of VPS hydrogels
A typical sample preparation process involves two key stages: (1) preparing a stable suspension of aerogel particles and (2) inducing VPS and filling with hydrogels.
Stage 1: to suspend the aerogel particles in water and facilitate VPS in subsequent steps, amphiphilic triblock-copolymer Pluronic F-127 (surfactant, Mw approximately 12 kDa), hydrophilic PAA (non-adsorbing polymer, Mw approximately 4,000 kDa) and hydrophilic PVA (suspension thickener, Mw approximately 146 kDa) were added while mixing superhydrophobic aerogel particles with water. In a typical procedure, 3.2 g of 10 wt% PVA solution, 3.2 g of 1 wt% PAA solution, 48 mg of 20 wt% F-127 solution and either 240 mg (denoted as 2 wt% aerogel content; Supplementary Table 5) or 480 mg (denoted as 4 wt% aerogel content; Supplementary Table 5) of aerogel particles were combined in a Thinky AR-100 mixer and mixed for 2 min. Subsequently, an extra 5.4 g of 1 wt% PAA solution was added, followed by another 2-min mixing. The resulting aerogel particle suspension is a white, viscous emulsion with low fluidity.
Stage 2: to induce VPS for the aerogel network, the aerogel suspension was poured into a customized acrylic mould sandwiched between two rigid acrylic plates with holes and a layer of dialysis tubing (molecular weight cut-off = 12–14 kDa). The VPS was triggered by immersing the samples into a 26 wt% NaCl solution at 60 °C. After varying immersion times, the samples were frozen at −5 °C for 3 h to induce physical crosslinking and then rinsed in deionized water three times (2 h per rinse). This process yielded a soft yet elastic VPS aerogel network. To fill the VPS aerogel network with polymers to yield VPS hydrogels, the dialysis tubing was replaced with new tubing (molecular weight cut-off ≈ 300 kDa), much higher than the molecular weight of the polymer used for filling. The encapsulated samples were then immersed in pre-gel solutions of PVA, gelatin, alginate, agarose or chitosan for 12 h. Finally, gelation was induced as described in Supplementary Information section 3.1, yielding VPS PVA, gelatin, alginate, agarose or chitosan hydrogels. After preparation, all samples were swollen in PBS solution three times before use. The detailed set-ups for VPS and filling have are illustrated in Supplementary Fig. 21. All samples used for the air-permeability measurements (including VPS gelatin, alginate, agarose and chitosan hydrogels in Fig. 3c) were prepared with a 4 wt% aerogel content.
Oxygen permeability tests
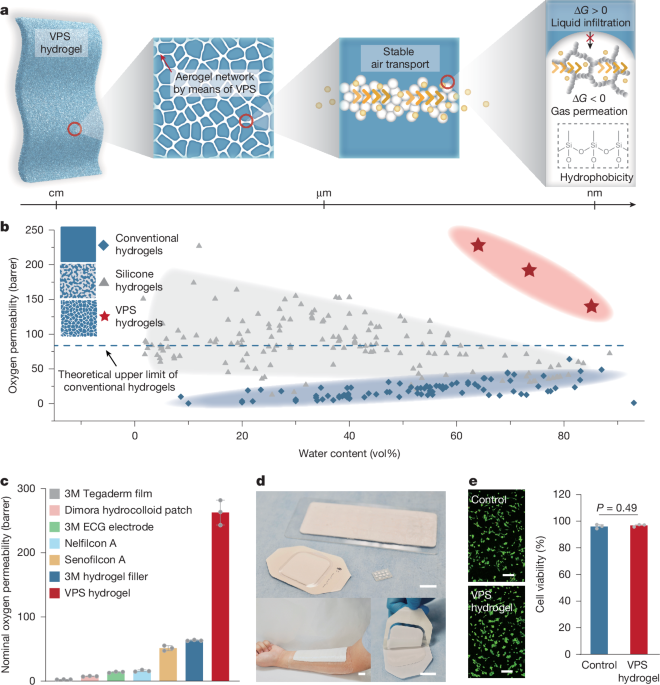
The oxygen permeability of hydrogels was tested with the polarographic method following the instructions of ISO 18369-4:2017 with a Rehder single-chamber system. Before the tests, the hydrogels were swollen in PBS buffer for 12 h. During the test, to keep the hydrogels moistened, the tests were carried out at 95% relative humidity throughout. Also, the testing sample was sandwiched by lens cleaning paper, which serves as the ‘aqueous bridge’ between the sample and electrode. The signal measured by the polarographic method is the current generated by an oxygen sensor over time I(t), in which t is time in minutes. The current at a steady state Is is defined as the I(t) at t (min) when \(\frac{I(t)}{I(t+5)} < 0.995\). As such, the preliminary oxygen permeability Dkpre is defined as
$${{Dk}}_{{\rm{pre}}}=\frac{0.278T({I}_{{\rm{s}}}-{I}_{{\rm{d}}})}{A}$$
in which T is the thickness of hydrogel (mm), Id is the dark current generated by the oxygen sensor when the oxygen level is zero (A) and A is the area of the cathode (cm2).
To obtain the corrected oxygen permeability of hydrogel samples, two more effects are required to be considered, including edge effects and boundary effect. The edge effects originate from the geometry of the electrode and hydrogel sample. For flat cathode and hydrogel samples, the oxygen permeability after considering edge effects Dkedge is expressed as:
$${{Dk}}_{{\rm{edge}}}=\frac{{DT}}{D+1.89T}{{Dk}}_{{\rm{pre}}}$$
in which D and T are the diameter and thickness of the hydrogel, respectively.
To eliminate the boundary effects raised from the inhomogeneity at the sample–air and sample–electrode boundary, we would plot the reciprocal transmissibility \(\frac{T}{{{Dk}}_{{\rm{edge}}}}\) against T and the slope of the least squares regression line is \(\frac{1}{{{Dk}}_{{\rm{corr}}}}\), in which Dkcorr represents the oxygen permeability after ruling out the edge and boundary effects.
Because the sample thickness of commercial products are determined, the oxygen permeability of these products (Fig. 1c) cannot eliminate the boundary condition by thickness extrapolation. Therefore, to compare the oxygen permeability between the VPS hydrogel and commercial products, we used the nominal oxygen permeability, which corresponds to the value after edge correction. The oxygen permeability together with sample thickness are presented in Supplementary Table 3.
Micro-CT characterization
The VPS hydrogel with 2 wt% aerogel content was selected for micro-CT characterization, performed using the ZEISS Xradia 620 Versa X-ray microscope. The VPS hydrogels were punched into 3-mm-diameter rounds and encased in a Kapton tube, sealed at both ends with epoxy resin, for micro-CT sampling. These samples were left stationary for 12 h to allow for the relaxation and stabilization of their elastic microstructures. We performed data analysis using the Dragonfly software package. For detailed network analysis, for each structure-development time, three regions of interest (volume equal to 750 × 750 × 750 μm3) were selected. Given the lower density of aerogels relative to water, aerogel particles manifest as dark spots in micro-CT scans. To accurately delineate areas occupied by these particles, the darkest 5% of voxels were initially selected and subsequently dilated to cover roughly 20% of the volume, minimizing the impact of noise on microstructure reconstruction. Connectivity and Euler characteristic numbers were derived from the domains of selected voxels. The OpenPNM module in Dragonfly facilitated the analysis of pore structures, emphasizing pores wider than 10 μm, approximating the size of aerogel particles. Unless specified otherwise, default settings were used throughout the analysis.
WVTR measurement
The WVTR was measured following the ASTM standard E96M-16 water method. Samples of polyurethane tapes, silicone tapes, hydrocolloid patches, pristine PVA hydrogel and VPS PVA hydrogel (4 wt% aerogel content) were first cut into round shapes with a diameter of 2 cm. These samples were then attached to the window of a diffusion cell containing 6 ml of deionized water, leaving a 1-mm air gap from the sample surface. The diffusion cells were stored in laboratory ambient environment with stable, controlled humidity at 67% and 21 °C for a duration of 72 h. The weight of the diffusion cells was recorded hourly. To isolate the true water vapour transmission through the sample from any intrinsic water loss of the hydrogel, we measured the mass of the hydrogel before and after the test and corrected the total chamber mass change accordingly. WVTR was calculated using the equation \({\rm{WVTR}}=\frac{({w}_{2}-{w}_{1})}{{At}}\), in which t represents the sample thickness, w1 and w2 represent the initial and final corrected masses of the diffusion cell, respectively, and A denotes the area available for water vapour transmission. Note that, because the WVTR test was conducted under the ambient environment, the oxygen conditions and pressure closely reflect performance in practical application environments.
Mechanical tests
Tensile test
Mechanical tests were conducted using a UStretch apparatus (CellScale) equipped with an 8.9-N load cell, operating at room temperature (22 °C). Samples were of approximate dimensions 15 mm × 6 mm × 0.8 mm and the loading rate was set at 0.1 s−1. During loading, force (F) and gauge displacement (ΔL) were recorded by the testing machine. Nominal stress (σ) was calculated using the formula \(\sigma =\frac{F}{{Wt}}\), in which W represents the undeformed sample width and t denotes the sample thickness. Strain (ε) was determined as \(\varepsilon =\frac{\Delta L}{{L}_{{\rm{i}}}}\), with Li representing the undeformed sample initial length. The Young’s modulus of the tested sample was calculated by \(E=\frac{\sigma }{\varepsilon }\).
The free-standing samples, including the VPS aerogel network (before filling with PVA), VPS PVA (after filling with PVA) and pristine PVA, were used for mechanical tests. To secure the samples during testing, they were clamped between grooved jaw clamps under mechanical pressure. Furthermore, images were captured during loading to verify stretch measurements and ensure that no slipping occurred.
Cyclic tensile fatigue test
Cyclic tensile fatigue tests were performed at 20% strain and 0.24 Hz for 10,000 cycles using the Instron 5944 materials testing system equipped with a 50-N load cell. Samples were of approximate in-plane dimensions 15 mm × 6 mm and the thickness of each sample was measured individually for stress calculation. Force–displacement data were continuously recorded to assess tensile mechanical stability (Supplementary Fig. 9a). To maintain the hydrogel in a stable hydrated state, all tests were conducted inside a custom-built plastic humidity chamber connected to a humidifier and an Inkbird Digital Humidity Controller IHC-200 humidistat. The relative humidity was maintained above 95% throughout the entire 11.5-h test.
Cyclic compression fatigue test
Cyclic compression fatigue tests were performed at 20% compressive strain and 0.46 Hz for 10,000 cycles using an Instron 5944 materials testing system equipped with a 50-N load cell. Samples had a disc geometry of 20 mm in diameter and 1.54 mm in thickness. Force–displacement data were continuously recorded to assess compressive mechanical stability (Supplementary Fig. 9b). To keep the hydrogel in a stable hydrated state, all tests were conducted inside the same custom-built plastic humidity chamber throughout the entire 6-h test.
Cyclic shear rheological test
Cyclic shear rheological tests were conducted on a TA Instruments Discovery HR-2 rheometer using a parallel-plate geometry with a gap of 1,320 µm. Measurements were performed in time-sweep mode under oscillatory shear at 2% strain and 1 Hz for 10,000 cycles. Samples had a disc geometry with a diameter of 20 mm and an initial thickness of about 1.4 mm. The evolution of the storage modulus was monitored to assess shear fatigue resistance (Supplementary Fig. 9c). To keep the hydrogel in a stable hydrated state, the sample was enclosed with the rheometer solvent-trap cover. A small amount of deionized water was added to the solvent reservoir/enclosed chamber, without direct contact with the sample, to generate a water-saturated humid environment around the sample. The cover remained sealed throughout the 2.8-h measurement.
Human tests
All human experiments were conducted by protocols approved by the Committee on the Use of Humans as Experimental Subjects, Massachusetts Institute of Technology (protocol number 2302000873R001) and guidelines were followed. Informed consent from all participants was obtained before inclusion in this study. Unless otherwise specified, the VPS hydrogel used for the human tests was the anti-dehydration VPS hydrogel described in Supplementary Information section 3.2.
Wear tests and skin physiological measurements
Wear tests were performed to evaluate skin conditions after prolonged contact with the VPS hydrogel and pristine PVA hydrogel (Supplementary Fig. 23). Hydrogel patches were attached to the forearm of each participant and worn for 24 h. After patch removal, skin hydration and TEWL were measured at 0, 5, 10, 15, 20, 25, 30, 35, 40, 45, 50, 55, 60, 120 and 180 min post-removal. At each time point, three readings were taken from different sites within the treated skin area. Skin hydration was measured using a Bio-Therapeutic bt-analyze skin moisture analyser and TEWL was measured using a Delfin VapoMeter. Before applying the hydrogel patches, ten measurements were collected from different sites on untreated forearm skin to establish the baseline range of healthy skin conditions. This baseline enabled comparison of post-wear skin responses while accounting for participant-specific differences in natural skin physiology. A total of n = 2 participants were included in the skin physiological tests, with three independent measurements of skin hydration and TEWL collected for each participant.
To evaluate changes in the air permeability of the VPS hydrogel during prolonged wear, a 7-day wear test was performed and the nominal air permeability was measured on days 1, 3, 5 and 7 (Supplementary Fig. 16). A total of n = 1 participant was included in this wear test, with three independent measurements conducted. To evaluate potential long-term skin irritation caused by the VPS hydrogel, an extra 10-day wear test was performed (Supplementary Fig. 13).
ECG recording and exercise protocols
VPS-hydrogel electrodes were prepared according to the procedure described in Supplementary Information section 3.4. A commercial breathable fabric-backed electrode (LEPU Medical disposable medical-grade ECG monitoring electrode) was used as the control. Fabric backing was intentionally used in both groups to isolate and emphasize the role of the hydrogel in maintaining stable skin contact, enabling reliable bioelectrical signal acquisition and improving wearing comfort, particularly under challenging conditions such as heavy perspiration. All ECG data were recorded using a Wellue ER1-LW wireless ECG event recorder.
Volunteer experiments were conducted to evaluate the effect of sweat accumulation on ECG signal quality. To ensure consistency, participants were instructed to maintain a similar workout intensity across all tests. The workout protocol was as follows: participants rested for 5 min, cycled for 10 min at a constant intensity of 80 rpm and ramp level 6 and then rested for an extra 5 min. ECG signals were recorded continuously throughout the 20-min test period. A total of n = 3 participants were included in these tests, with two independent tests conducted for each participant.
To evaluate the effect of prolonged wear on ECG signal quality, three 10-day ECG tests were conducted. Participants performed indoor cycling on days 4, 7 and 10. All workout tests followed a standardized protocol: participants cycled for 15 min at a consistent intensity of >80 rpm and then rested for an extra 5 min. No restrictions were imposed on the participants’ daily activities, including sleep, social interactions or exercise, with respect to activity type, timing or duration. In each test, the same pair of VPS-hydrogel electrodes was used throughout the entire 10-day period. ECG data were continuously recorded each day over the 10-day period. Data collection was paused for approximately 30 min each day to allow data retrieval and device charging. During these interruptions, the ECG patch, including the VPS-hydrogel electrodes and adhesive backing, remained attached to the skin and the same patch was used continuously throughout the 10-day test. Throughout the test, the device and the two VPS-hydrogel electrodes were exposed to ambient air, except during showering, when the device was protected with 3M Tegaderm film to prevent water ingress. ECG data were first processed using the ECG Analysis System provided by Wellue and further analysed in MATLAB.
Electrical tests
To measure electrical conductivity, hydrogel samples were prepared with dimensions 50 mm length, 5 mm width and 1 mm thickness. A 34450A multimeter (Keysight Technologies) was used for four-wire resistivity measurements. Gold-plated copper electrodes were attached to the surface of the hydrogel sample. To ensure good contact, two glass plates were gently pressed against the hydrogel and electrodes. The electrical conductivity (σ) was calculated using the formula \(\sigma =\frac{{IL}}{V{WT}}\), in which I represents the current through the sample, L is the spacing between the voltage-measuring electrodes, V is the measured voltage, W is the sample width and T is the sample thickness.
For electrochemical impedance measurements, hydrogel samples with dimensions 10 mm length, 10 mm width and 1 mm thickness were used. An Autolab PGSTAT204 (Metrohm) was used for impedance potentiostatic measurements. The tests were conducted in an electrochemical cell configured with the hydrogel sample as the working electrode, a Pt sheet as the counter electrode, an Ag/AgCl electrode as the reference electrode and PBS as the electrolyte. The impedance was measured over a frequency range 10−1 Hz to 105 Hz, applying a sine wave voltage with an amplitude of 0.01 VRMS.
Skin contact impedance was measured using the same VPS-hydrogel electrodes (fabrication presented in Supplementary Information section 3.4) as those used in the ECG test. The two electrodes were attached to the forearm skin with a centre-to-centre distance of 5 cm for 10 days. Throughout the test, the VPS-hydrogel electrodes were exposed to ambient air, except during showering, when the device was protected using 3M Tegaderm film to prevent water ingress. An Autolab PGSTAT204 (Metrohm) was used for impedance potentiostatic measurements over a frequency range 1 Hz to 106 Hz, applying a sine wave voltage with an amplitude of 0.1 VRMS.
Acoustic tests
The ultrasound transducer used for actuation was a custom device fabricated from modified PZT4 ceramic, featuring a 20-mm aperture and a focal length of 13-mm. Hydrophone measurements (HGL-0400, Onda) were performed to characterize the acoustic output before the actuation experiments. During actuation, the transducer was fixed in position and the hydrogel-based acoustic actuator (5 cm length × 2 cm width × 1.5 mm thickness) was placed at the acoustic focus under hydrophone guidance. The applied acoustic pressure was varied from 1.82 MPa to 10.94 MPa by varying the AC voltage amplitude applied on the ultrasound transducer.
The imaging experiments were carried out using a Vantage 256 system (Verasonics) equipped with an L22-14vXLF linear array transducer. Compound plane-wave imaging with nine angles was used as the imaging method. For imaging, hydrogel samples were prepared in circular, triangular and square geometries, in which the circular samples had a diameter of 6 mm and both the triangular and square samples had side lengths of 6 mm. These samples were placed in the elevation focal region of the transducer array.

