To people with cancer, tumours can seem like amorphous clumps of defective cells, relentlessly focused on unconstrained growth and invasion. But this does not mean that they’re homogeneous. Cancerous cells have a broad spectrum of mutations, and growths contain healthy host cells, blood vessels and microscale fronts at which immune cells wage war with malignant tissue.
Until around a decade ago, researchers were ill-equipped to explore this tumour microenvironment. But the emergence of tools that can spatially map large numbers of biomolecules, such as RNA and protein, has caused something of a revolution. Indeed, researchers are increasingly weaving these layers of information together to create rich ‘multiomic’ spatial maps that can classify diverse cell types and probe their activities throughout a tumour.
How to make spatial maps of gene activity — down to the cellular level
“We’re not just talking about tumour heterogeneity any more — we can see it,” says Arutha Kulasinghe, a cancer biologist at the University of Queensland in Brisbane, Australia. “We can see pockets of drug resistance, sensitivity and different biology directly on the tissue.” The spatial factors that contribute to carcinogenesis and disease progression are also increasingly visible, revealing potential vulnerabilities in the process. Such capabilities could transform cancer research and pathology, making it possible to model, interpret and perhaps predict tumour biology with unprecedented sophistication.
But the barriers to entry are high. There are many technology platforms for spatial omics analyses, and the experiments can be costly and complicated. Even with data in hand, cancer researchers can face a computational odyssey before they can make sense of their results. “Everybody wants what I like to call the ‘blender theory’ of multiomics, which is where you throw all the data sets together and it will tell you the answer as to what’s in them” says Elana Fertig, a bioinformatician at Johns Hopkins Medicine in Baltimore, Maryland. “I’ve become less and less convinced that’s possible, because everybody has a different question that they want to ask.”
Welcome to the neighbourhood
For more than a decade, biologists have been studying tumour microenvironments by breaking tissue samples into individual cells and characterizing their molecular contents. These single-cell omics technologies are fairly simple to use, at least for RNA analysis. Instruments such as the Chromium from 10x Genomics in Pleasanton, California, can survey gene expression across millions of individual cells.
Some researchers, such as cancer genomicist Dan Landau at the New York Genome Center in New York City, have even extended these tools to perform multiomic experiments — coupling transcription to other biological features, such as genomic mutations or epigenetic signals that directly govern gene expression at the single-cell level. “The vision is to try to start understanding how those layers are talking to one another,” says Landau.
Such experiments can categorize cell types and reveal which biological processes those cells are engaged in — but they lack essential context. “It was pretty clear early on that we miss a lot of information by dissociating a tumour into single cells,” says Bernd Bodenmiller, a systems biologist at the University of Zurich in Switzerland and the Swiss Federal Institute of Technology. For example, the efficacy of immunotherapy against a given tumour depends not only on which immune cells are present, but also where they are in the tumour.
In 2014, Bodenmiller helped to pioneer the spatial omics era when he and his colleagues combined a laser ablation technique with mass spectrometry to detect and localize proteins labelled with various metal-tagged antibodies (see Nature 567, 555–557; 2019). They called the approach imaging mass cytometry (IMC), and used it to quantify 32 proteins at subcellular resolution in a breast-tumour specimen. Bodenmiller says that these early experiments demonstrated the importance of spatially localized communities of inter-communicating cells, now known as ‘cellular neighbourhoods’, which would have been invisible using dissociated single cells. “These were the first striking examples for me of how the spatial arrangement of tumour cells — and how they form communities with other cells — is really strongly prognostic for patient outcome,” he says.
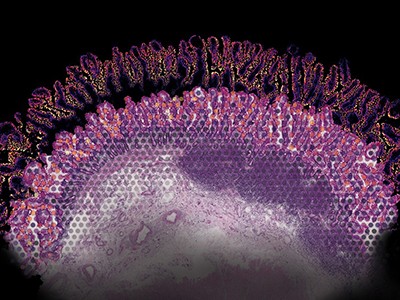
Most spatial experiments today focus on the transcriptome, and there are numerous commercial platforms available. Some are sequencing-based, such as the Visium platform from 10x Genomics, which builds on a method developed in 2016 (see Nature 606, 1036–1038; 2022). Tissue slices are prepared on a slide coated with an array of location-barcoded DNA strands. The RNA is then released from the tissue, captured by these strands and converted to DNA for sequencing; the barcode associated with each sequence reveals where it was on the slide.
Other methods are imaging-based. For example, the MERSCOPE platform from Vizgen in Cambridge, Massachusetts, is based on the technique MERFISH. First reported1 in 2015, the technique involves the serial labelling of tissue samples with fluorescently tagged probes that enable direct visualization, identification and quantification of transcripts in a specimen.
Starfish enterprise: finding RNA patterns in single cells
The choice of platform involves trade-offs. “Generally, the imaging-based technology can capture a larger piece of tissue area, whereas with the sequencing-based [methods] you capture a lot less,” says Kai Tan, a research oncologist at the Children’s Hospital of Philadelphia in Pennsylvania. Imaging-based methods also tend to offer superior spatial resolution — down to the cellular or even sub-cellular scale — but are more labour-intensive and constrained, typically requiring users to select which genes to probe rather than broadly interrogating the tissue RNA, and profiling a smaller fraction of the transcriptome than dissociated, single-cell methods. Sequencing methods can detect even unexpected transcripts, albeit often at lower spatial resolution. But “those two worlds are converging”, Landau notes.
For instance, the Slide-tags method offers an inventive alternative, in which the address-defining barcodes for spatial transcriptomics are delivered directly into the confines of the cell nucleus, providing subcellular resolution2. These nuclei can then be isolated and analysed more extensively with a range of single-cell methods.
Regardless of the platform, spatial transcriptomics is unlocking exciting opportunities for cancer researchers. For example, neurosurgeon Dieter Henrik Heiland at the University of Freiburg in Germany has used these techniques to tease apart the conditions that foster the growth and invasive behaviour of brain tumours, such as glioblastoma — specifically, the impact of certain myeloid bone marrow cells on the activity of immune system T cells. “We could identify defined patterns, defined architectures that we could not do before with any other technologies,” he says.
A multiplicity of maps
Increasingly, however, transcriptomics represent not the entirety of the spatial analysis but one component thereof — a ‘baseline layer’, as Heiland puts it. “Then, we think what we can do on top.”
Often, that’s spatial proteomics. Although all proteins are translated from messenger RNAs, not all mRNAs give rise to proteins. Kulasinghe says that in his experience, spatial patterns of RNA and protein can differ by up to 50% in a given sample, such that transcription levels might not reliably predict protein output. Proteins can also form complexes and undergo chemical modifications that would be impossible to determine from transcriptomic data alone. Proteomic analysis is therefore a crucial component in understanding tumour spatial biology. “People are stuck with proteins forever,” says Garry Nolan, an immunologist at Stanford University in California.
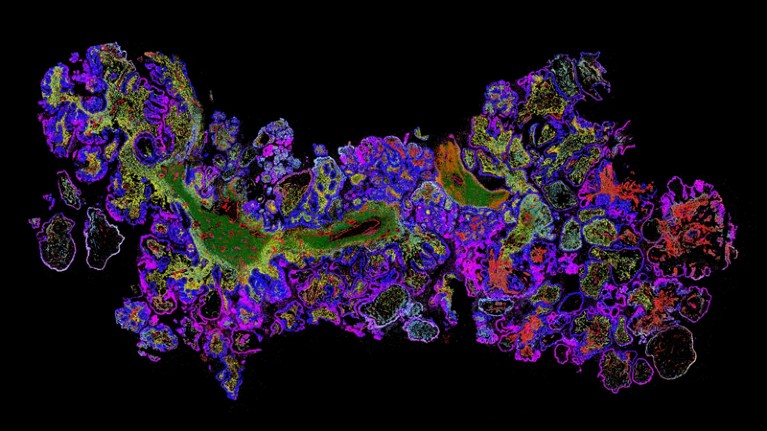
Data image created using the MERSCOPE platform of the genes in ovarian cancer tissue.Credit: Vizgen
Today’s spatial proteomics toolbox includes methods that can profile dozens or even hundreds of proteins at a time. For example, Nolan’s group developed3 the widely used CODEX method (now commercialized by Akoya Biosciences of Marlborough, Massachusetts, as the PhenoCycler system) in 2018. This approach uses DNA-tagged antibodies for up to 100 protein targets, which are sequentially detected with an enzymatic process that specifically adds dye-labelled nucleotides to a subset of those DNA tags; these dyes are then cleaved off before the next imaging round. Similarly, the GeoMx platform from NanoString in Seattle, Washington, allows researchers to image RNA at the same time as several hundred proteins in the same sample.
Fertig and her team reported the combined power of spatial proteomics and transcriptomics in a study that explored the involvement of cells known as fibroblasts in the progression of premalignant pancreatic growths to cancer4. “With the transcriptomics data, we were able to find the fibroblasts and determine their impact on epithelial cells,” Fertig says. The method lacked the spatial resolution to discriminate between cell types fully, but layering on IMC data revealed how some cancer-associated fibroblasts help to establish a microenvironment that promotes malignant growth.
Perhaps the most direct readout of what a cell is doing at any given moment is the metabolome — the sugars, lipids, peptides and other biomolecules that act as inputs and outputs of biological processes. Several groups are mapping the metabolome using imaging mass spectrometry, in which a laser is scanned over a specially prepared sample to generate spatially localized chemical signatures. “The beauty of the technology is you basically get a completely different picture of your tissue than what you have in your transcriptomic data,” says Heiland. In one 2022 study, Heiland and his colleagues combined this approach with spatial transcriptomics and imaging mass cytometry to map out patterns of oxygen deprivation in glioblastoma. They found that hypoxic conditions lead to more-severe genomic disruption and abnormal gene expression5.
Room for error
Still, spatial omics can be intimidating for newcomers. “Everybody wants to adopt spatial, but it’s overwhelming,” says Jasmine Plummer, a geneticist at St Jude Children’s Research Hospital in Memphis, Tennessee. As head of the hospital’s Center for Spatial Omics core facility, she advises users to “think about a specific question you want to answer, not just a fishing expedition”, and then select the method that provides the necessary resolution, multiplexing or other capabilities.
Some platforms allow users to directly survey multiple molecular categories at once. For example, the NanoString GeoMx and CosMx instruments can perform both protein and gene-expression analysis, and the Landau group collaborated with 10x Genomics to achieve similar analyses using Visium6. But Bodenmiller cautions that in some cases, “you don’t get the optimum of each method” with simultaneous analyses. For example, the enzymatic digestion steps required to liberate RNA from tissue can damage proteins. But optimized workflows are emerging to serially analyse the same specimen using multiple platforms, with the sample-preparation process modified to minimize loss between steps. “I think researchers have realized that you need optimized technology stacks,” says Kulasinghe.
Cell maps reveal fresh details on how the immune system fights cancer
Other groups perform parallel analyses on consecutive thin sections derived from the same tumour sample, then align and merge the resulting data sets. This is harder than it sounds, however. “If you go from one tissue section to the next, you only find about 50–60% of the cells in both sections,” says Bodenmiller. Furthermore, different experimental formats can produce radically different data types, confounding integration. For example, an IMC experiment yields an array of pixels denoting different proteins at subcellular resolution, whereas sequencing-based transcriptomic experiments map ‘spots’ that often encompass multiple cells. “Every data set has to be treated on its own, and you have to figure out how we can now integrate those data by some kind of similarity measurement,” says Heiland.
There is also the fundamental challenge of segmentation: accurately defining and classifying individual cells in the spatial data. “If you cannot accurately segment the boundary of the cell, then everything downstream will be off,” says Tan. Different spatial platforms bring different challenges, and there are no universal solutions — Kulasinghe’s team has tested multiple algorithms for this purpose and observed inconsistent performance. As a solution, his team draws boundaries based on a ‘majority vote’ derived from multiple algorithms. Kulasinghe also emphasizes the importance of using conventional histology stains to fact check algorithmic analyses and establish ‘ground truth’ for a spatial study.
Above all, careful planning is essential. Spatial omics experiments are expensive — Kulasinghe says that a single imaging-based transcriptomics assay can cost nearly US$10,000 — and can generate terabytes of data. “Getting pilot data in this realm is important,” says Plummer. “I don’t think you want to take a whole deep dive in until you’ve understood your data a little bit first.”
The final frontier?
Fortunately, the number of core facilities is growing, giving researchers access to expert guidance as well as the technological capabilities needed to perform spatial analyses.
In parallel, international and cross-institutional research efforts are leveraging single-cell — and, increasingly, spatial — multiomic analysis at unprecedented scale, including the US National Institutes of Health-backed Human Tumour Atlas Network and global consortium the Human Cell Atlas. These efforts are developing and optimizing analytical pipelines and tools, and, more importantly, generating vast collections of reference data for healthy and diseased tissues that the scientific community can use to interpret future experiments. “Without those large initiatives, we would really not be at the state of technology and possibility where we are now,” says Bodenmiller.
NatureTech hub
Meanwhile, some spatial-omics pioneers are looking to new horizons. Bodenmiller’s group reported an alternative to IMC in which antibodies are labelled with isotopic tags that can be detected and distinguished by X-ray imaging rather than mass spectrometry, allowing rapid mapping of many proteins at once throughout the specimen7. He says that the method could be an excellent fit for 3D imaging, and is fast because it avoids the slow scanning process that is typical of IMC. First, however, the team must work out logistical challenges, such as how to efficiently deliver antibodies into the interior of intact tissues.
The imminent deluge of spatial data will also provide a treasure trove for researchers looking to apply deep-learning methods to cancer. This includes ‘digital pathology’ strategies, in which artificial-intelligence algorithms are trained to correlate features on conventional pathology slides with molecular indicators that are associated with tumour identity, prognosis and susceptibility to treatment. Companies are already entering this space with assays that guide drug selection based on spatial data, and Kulasinghe sees opportunities to assess immune activity in a tumour or predict the likelihood of metastasis without the need for spatial assays in the clinic. “This can give us deeper insights into the tumour microenvironments that ultimately associate with clinical endpoints,” he says.
For his part, Nolan predicts a post-data world, in which the research priority shifts from generating molecular maps to using them to train AI models that reveal hidden vulnerabilities. “We’re going to be able to create a virtual tissue that looks just like colon cancer,” he says. “Then you can start to change the parameters, and say: ‘OK, how do I stop the following structure from forming?’”


