We integrated deep phenotyping data27 available for most UKB participants and performed genetic association analysis across selected disease outcomes captured with electronic health records and molecular and physical measurement phenotypes, many of which are well-established disease biomarkers. Association testing was performed for all observed genetic variants and using several genetic models; we included single-variant tests, multi-ancestry meta-analysis, rare-variant collapsing analysis and SV analysis (Supplementary Methods).
Genome-wide association analysis
Genome-wide association analysis for individual SNPs and small indels was performed using the GraphTyper dataset in each ancestry cohort for 764 ICD-10 codes (n cases >200) and 71 selected quantitative phenotypes (n > 1,000; Supplementary Table 7). For the NFE cohort, we estimated the gain in discovery and improvement of fine mapping in association signals observed with the WGS call set versus variants observed in the imputed array genetic dataset1 using equivalent analysis results with the same cohort and phenotyping strategy. We observed that whereas the increase in discovery was modest for common variant associations (Supplementary Fig. 3), the ability to fine map association signals was improved, and this was not due only to the loss of power in association tests attributable to imputation accuracy in the array dataset. We identified 33,123 associations (P value < 5 × 10⁻⁸) across 763 binary and 71 quantitative genome-wide association study (GWAS) datasets (Supplementary Methods). Of these, 3,991 (12.05%) are new to the WGS data when compared to those identified using only array imputed variants. As expected, most associated variants novel to WGS are rare variants, including 86% of associations with minor allele frequency (MAF) <0.0001, whereas only 2% of associations with MAF > 0.1 are novel to WGS (Supplementary Fig. 3). Among the 29,357 associations identified using array imputed variants, 2,984 had a different, more significant, lead variant in the WGS variants, resulting in improved fine mapping of the association signals observed (Supplementary Table 8). For example, a common variant association uncovered by WGS that was previously missed by the imputed array data is near genes MRC1 and TMEM236 in chromosome 10, where we identified an association between rs371858405 (NFE MAF = 0.24) and reduced hypothyroidism risk (odds ratio (OR) = 0.94, P value = 2.6 × 10⁻¹¹). In the imputed data, the region within the WGS lead variant has sparse SNP coverage when compared to adjacent regions (Supplementary Fig. 4b), probably a result of a patch to the hg19 reference genome (chr10_gl383543_fix) that occurred after the UKB genotyping array was designed. A second example illustrating a new biological findings with rare genetic variation is the observation of a rare frameshift variant (MAF = 5.1 × 10⁻⁵) in FOXE3 chr. 1: 47417015:GC:G (rs1176723126) found to be significantly associated with the first occurrence phenotype ‘other cataract’ (ICD-10 code H26; P value = 6.2 × 10⁻⁹; Supplementary Fig. 4b). The link between FOXE3 and cataract, and other ocular diseases, was reported in previous familial studies and human and mouse disease models28, but the association was not observed in the UKB imputed array or meta-analyses that included the UKB imputed array29.
Multi-ancestry meta-GWAS
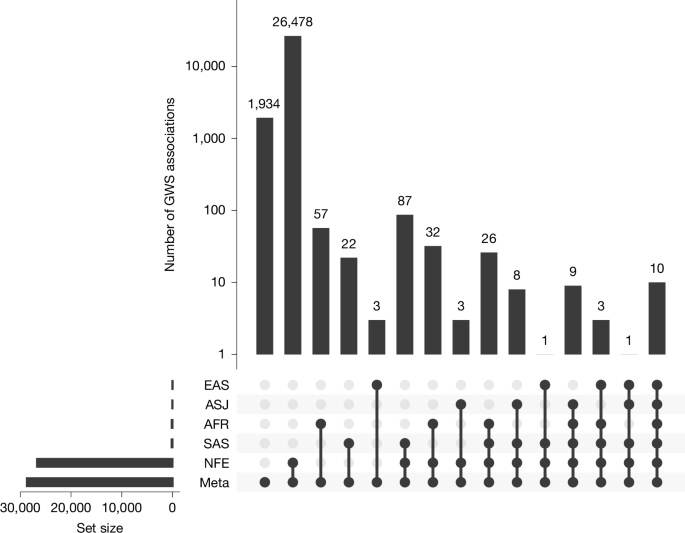
To examine multi-ancestry genetics of tested health-related phenotypes, we performed trans-ancestry meta-analysis of the GraphTyper GWAS data across 5 ancestries for 68 quantitative traits with ≥1,000 measurements in at least 2 ancestries and 228 ICD-10 disease outcomes with ≥200 cases in at least 2 ancestries. We identified 28,674 genome-wide significant (GWS; P value < 5.0 × 10⁻⁸) associations in the meta-analysis (Supplementary Methods, Supplementary Fig. 5 and Supplementary Table 9); of these, 1,934 associations were observed only in the meta-analysis, 26,478 were also observed in the NFE analysis, 82 were observed only in 1 of the non-NFE cohort analyses, and the remaining 180 associations were observed in more than 1 ancestry cohort (Fig. 2 and Supplementary Table 10). Among the 28,674 identified associations, 4,760 (16.6%) were not previously reported in the GWAS Catalog or OpenTargets30 (Supplementary Methods, Supplementary Fig. 3b and Supplementary Table 9).
Of the meta-analysis significant associations, 126 were more significant in non-NFE ancestries (lead variant with the smallest P value) despite the much smaller sample size compared to NFE (Supplementary Fig. 6a): 83 with strongest signals in AFR, 37 in SAS, 5 in EAS and 1 in ASJ. Almost all 126 significant sentinel variants had MAF <0.5% in NFE; the median MAF enrichment compared with NFE is highest in AFR (MAFAFR/MAFNFE) = 828.49, followed by EAS and SAS with a relatively wide range of enrichment (Supplementary Fig. 6b). For example, we observed ancestry-specific associations in the HBB locus (Extended Data Fig. 3). The lead variant, rs334 (chr. 11:5227002:T:A), a missense variant in the HBB gene, is the primary cause of sickle cell disease, resulting in abnormal haemoglobin. Despite causing sickle cell disease, rs334-A is specifically common in AFR, driven by its protective effect against malaria and selective advantage in AFR31. One HBB splice site variant rs33915217 (chr. 11:5226925:C:G) is associated with β-thalassaemia and anaemia with elevated frequency specifically in SAS, potentially shaped by genetic drift, founder effect or unknown selective advantage32. Another HBB nonsense variant, rs11549407 (chr. 11:5226774:G:A), is associated with thalassaemia and anaemia detectable only in NFE given the large size (P value < 5.6 × 10−62, β = 6.9). rs11549407-A introduces a premature stop codon, leading to an unstable haemoglobin molecule, but it has not been shown to confer protection against malaria or other pathogens. Under the same selection pressure of malaria, a G6PD missense variant rs1050828 (chr. X:154536002:C:T), which causes the G6PD deficiency and haemolytic anaemia but provides protection against severe malaria, reaches high frequency in AFR (14.7%) but remains rare in NFE (0.005%). It is an AFR-specific GWS signal linked to increased reticulocyte and bilirubin levels, indicating compensatory release triggered by haemolysis.
Loss-of-function variants in WGS
Naturally occurring human genetic variation known to result in disruption of protein-coding genes provides an in vivo model of human gene inactivation. Individuals with loss-of-function (LoF) variants, particularly those with homozygous genotypes, can therefore be considered a form of human ‘knockouts’. Studying human knockouts affords an opportunity to predict phenotypic consequences of pharmacological inhibition. Besides putative LoF (pLoF) variants that can be predicted on the basis of variant annotation, ClinVar23 also reported pathogenic or likely pathogenetic (P or LP, respectively) variants with clinical pathogenicity. Among the 490,000 UKB WGS participants (GraphTyper dataset), we found that there are 10,071 autosomal genes with at least 100 heterozygous carriers and 1,202 autosomal genes with at least 3 homozygous carriers. Among the 81 genes recommended by the American College of Medical Genetics and Genomics (ACMG)33 for clinical diagnostic reporting, we found 7,313 pLoF, P or LP variants carried by 51,107 individuals. Furthermore, there are 81 homozygous carriers of pLoF, P or LP variants found in 14 ACMG genes, of which 56 participants carry mutations in DNA repair pathway genes such as MUTYH, PMS2 and MSH6 (Supplementary Table 11). Among them, a subset are clinically actionable genotypes with a confirmed functional impact in the corresponding inheritance mode. Further validation, and confirmation with ACMG diagnostic criteria, is needed to determine which variants are clinically actionable.
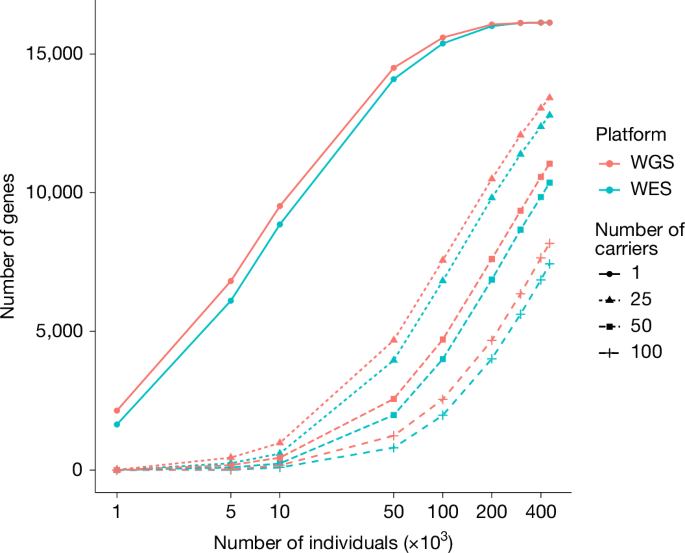
Comparing the UKB WGS dataset versus the WES dataset, among the same set of 450,000 participants, about 16,000 autosomal genes harbouring pLoF, P or LP variants in ≥1 carriers in both WGS and WES. However, WGS enabled us to find more carriers of high-impact variants (for example, the median difference in the number of carriers is 44 more in the WGS dataset compared to the WES dataset for the gene sets with >100 carriers; Fig. 3). Partially attributable to quality control criteria (Supplementary Methods), this is also expected given the more even and deeper coverage in WGS.
Rare-coding-variant association studies with WES and WGS
Gene-level collapsing analysis, in which aggregation of rare variants is tested for association with disease, has emerged as a powerful method for identifying gene–phenotype associations with high allelic heterogeneity21,34. So far, most collapsing analyses have used WES data35. We reasoned that the greater coverage of WGS compared to WES could increase power to detect gene–phenotype associations. We performed two collapsing analysis-based phenome-wide association studies (PheWAS) on an identical sample of 460,552 individuals using both WES- and WGS-based protein-coding regions (Supplementary Methods). All results for rare-variant collapsing analyses use the single-sample DRAGEN variant calls. In total, we tested for the association between 18,930 genes and 751 phenotypes (687 binary ‘first occurrence’ phenotypes and 64 quantitative traits that met our inclusion criteria; Supplementary Methods and Supplementary Table 12) using 10 non-synonymous and 1 synonymous control collapsing analysis models (Supplementary Table 13 and Supplementary Methods). We meta-analysed the separate ancestry strata and set the significance threshold at P value ≤ 1 × 10⁻⁸, which was previously empirically validated21.
In total, we identified 1,359 significant gene–phenotype associations, of which 87.4% (1,188) were significant in both the WES and WGS PheWASs (184 binary and 1,004 quantitative associations), 7.7% (105) were significant only in the WGS PheWAS (23 binary and 82 quantitative associations), and 4.9% (66) were significant only in the WES PheWAS (15 binary and 51 quantitative associations; Supplementary Table 14). There was high correlation between −log10[P values] derived from WES and WGS (Spearman’s rank correlation coefficient = 0.95, P < 2.2 × 10⁻¹⁶; Supplementary Fig. 7). Across both binary and quantitative traits, there were 29 genes with significant associations unique to WGS and 20 genes with significant associations unique to WES (Supplementary Fig. 8). Three genes uniquely associated with either technology are in the major histocompatibility complex region: VWA7 (WES) and HLA-C and C2 (WGS). Fewer than 3.3% of gene–phenotype pairs had an absolute difference in −10 × log10[P values] of greater than 5 units and fewer than 0.56% had greater than 10 units (Supplementary Fig. 9). Across all 14,130,325 gene–phenotype associations (significant and non-significant), there were 54,818 with greater than a 10-unit difference that achieved a lower P value in the WGS results, compared to 23,687 that achieved a lower P value in the WES results (Extended Data Fig. 4).
We identified 95 significant gene–phenotype associations with 15 genes recurrently mutated in clonal haematopoiesis and myeloid cancers as described previously36, which are potentially driven by somatic qualifying variants. Of these, 70 were detected by both technologies, 11 were unique to WGS and 14 were unique to WES. Associations unique to WGS included protein-truncating variants in TET2 and other disorders of white blood cells (WGS P value = 3.62 × 10⁻¹³, OR = 8.08, 95% confidence interval (CI) = 5.02–12.40; WES P value = 4.23 × 10⁻⁷, OR = 6.18, 95% CI = 3.26–10.70). We also found an association between protein-truncating and predicted damaging missense variants in SRSF2 and reticulocyte percentage (WGS P value = 1.92 × 10⁻⁶, β = 0.30, 95% CI = 0.17–0.42; WES P value = 3.7 × 10⁻¹⁸, β = 0.60, 95% CI = 0.47–0.74) significant only in the WES results (Supplementary Table 14).
Overall, although association results between the WES and WGS DRAGEN datasets are highly correlated, there are genes for which coverage is improved in WGS, resulting in modestly improved association statistics. One example is PKHD1, for which associations with three quantitative phenotypes were more significant in WGS than WES: γ-glutamyl transferase (WES P value = 4.63 × 10⁻¹⁸, β = 0.19, 95% CI = 0.15–0.24; WGS P value = 1.24 × 10⁻¹⁹, β = 0.20, 95% CI = 0.16–0.24), creatinine (WES P value = 3.85 × 10⁻¹⁰, β = −0.04, 95% CI = −0.06 to −0.03; WGS P value = 2.14 × 10⁻¹², β = −0.05, 95% CI = −0.06 to −0.03) and cystatin C, which achieves significance only in the WGS data (WES P value = 3.02 × 10⁻⁸, β = −0.05, 95% CI = −0.07 to −0.03; WGS P value = 3.04 × 10⁻⁹, β = −0.04, 95% CI = −0.06 to −0.03; Supplementary Table 14). The number of samples with ≥10× coverage of PKHD1 is lower in WES than WGS at specific protein-coding sites (Supplementary Fig. 10), demonstrating the value of WGS to ascertain variants and associations in regions not well captured by WES.
We calculated coverage statistics in the WES and WGS datasets for each protein-coding gene (Supplementary Table 15). There are only 638 genes in the WGS for which <95% of the protein-coding sequence had on average at least 10× coverage across the cohort, compared to around twice as many (1,299) in the WES dataset21. This improved coverage of some genes in the WGS data compared to WES demonstrates the value of WGS for improved discovery potential in some protein-coding regions.
Rare-variant PheWAS of UTRs
To understand the contributions of rare UTR variants to phenotypes, we used the UKB single-sample DRAGEN WGS data to compile about 13.4 million rare (MAF < 0.1%) variants from both 5′ and 3′ UTRs of protein-coding genes across the 5 defined ancestries. We performed two multi-ancestry collapsing PheWASs: UTR alone and UTR plus protein coding.
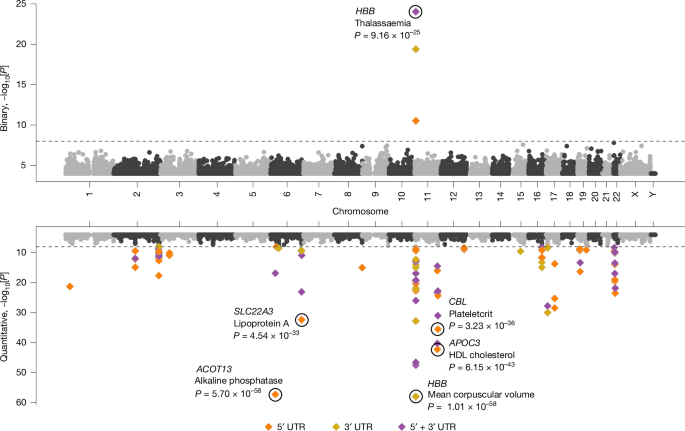
We tested the aggregate effect of UTR-alone qualifying variants on binary and quantitative phenotypes for 5′ UTRs alone, 3′ UTRs alone and 5′ and 3′ UTRs combined (Supplementary Table 12). Each was run using six collapsing analysis models to capture a range of MAF and CADD37,38,39 thresholds. Any UTR sites that overlapped a protein-coding site were omitted. Using a previously described n-of-1 permutation approach21, we confirmed that P value ≤ 1 × 10⁻⁸ is an appropriate significance threshold (Supplementary Methods). We observed 63 significant associations (1 binary trait and 62 quantitative traits) comprising 32 unique genes and 37 unique phenotypes (Fig. 4 and Supplementary Table 16). Many of these gene–phenotype associations have previously been identified with rare protein-coding variants or have GWAS support38,39. For example, 32 of 63 (51%) signals were also significant in the WGS protein-coding collapsing PheWAS already described, and 52 of 63 (83%) had a common variant within 500 kilobases (kb) significantly associated with the same phenotype in the UKB WGS Consortium GWAS already described (Supplementary Methods and Supplementary Table 16). The observed associations are likely to include some UTR variants that are causally linked to the phenotype, and some that are in partial linkage disequilibrium with nearby common variant associations.
Miami plot of UTR-based rare-variant PheWAS associations for 687 binary (top) and 64 quantitative (bottom) phenotypes across all 6 collapsing models. Significant 5′, 3′ and 5′ and 3′ combined associations are represented in different colours. The top significant binary associations and the significant quantitative associations with P value < 1 × 10⁻³⁰ are labelled. P values are unadjusted and are from Fisher’s exact two-sided tests (for binary traits) and linear regression (for quantitative traits).
We next explored the combined effect of rare UTR variants and protein-truncating variants using two different models. We observed 27 and 157 significant associations for binary and quantitative phenotypes, respectively (Supplementary Table 16). Ten associations that achieved significance in this UTR plus protein-coding PheWAS were not significant in the protein-coding-alone collapsing PheWAS, suggesting that those associations were augmented by incorporating UTRs (Supplementary Table 16). Furthermore, 27 suggestive (1 × 10⁻⁸ < P < 1 × 10⁻⁶) associations in the UTR plus protein-coding PheWASs did not reach this threshold in the protein-coding-alone collapsing PheWAS (Supplementary Table 16). For instance, NWD1 is suggestively associated with kidney calculus (P value = 7.53 × 10⁻⁷, OR = 1.63) in the UTR plus protein-coding PheWAS, but not in the protein-coding-alone or the UTR-alone collapsing PheWASs. This is mostly driven by rare 3′ UTR variants (Supplementary Table 17), although the qualifying variants are distributed throughout the gene. No significant common variant associations were observed between NWD1 (±500 kb) and kidney calculus in the UKB WGS Consortium GWAS; however, a common synonymous variant, rs773852, is associated with kidney calculus in a Chinese Han population40 Our study demonstrates the potential of WGS in identifying non-protein-coding variant to phenotype associations.
Phenotypic effects of SVs
Associations identified in the previous UKB 150,119 release22 from the WGS consortium were mostly replicated. The new UKB release allows the identification of rarer SVs and assesses their impact on phenotypes. We present exemplary associations, anchoring on genes and variants that have a well-established association with phenotype.
Genes are typically affected by several SVs. Previously22, we highlighted an association of non-HDL cholesterol with a 14,154-bp deletion overlapping PCSK9, a gene encoding a proprotein convertase involved in the degradation of LDL receptors in the liver. In the current release, 13 SVs overlapping coding exons in PCSK9 are found, carried by 163 individuals, bringing the total number of PCSK9 pLoF carriers to 1,124 The previously reported SV is the most common of the 13 variants, seen in 111 individuals. The carriers had (1.22 s.d.) lower levels of non-HDL cholesterol, with carriers of other PCSK9 deletions collectively averaging 0.51 s.d. lower levels.
A 5,200-bp deletion on chr. 12: 56,451,164–56,456,364, is carried by 15 NFE individuals and it strongly associates with cataracts (OR = 25.3, P value = 6.3 × 10⁻⁷, MAF = 0.0015%). It deletes all 4 coding exons of MIP while preserving its 5′ UTR region and not affecting other genes. MIP encodes the major intrinsic protein of the lens fibre and rare deleterious missense, and LoF variants are linked to autosomal dominant cataract41,42.
The ACMG43 recommends reporting actionable genotypes in genes linked with diseases that are highly penetrant with established interventions. We previously reported22 that 4.1% of UKB individuals carry an actionable SNP or indel genotype. An additional 0.60% of individuals carry SVs predicted to cause LoF in autosomal dominant LoF, P or LP genes. If confirmed44, this increases the number of individuals with an actional genotype by 14.8%.
ClinVar45, a database of clinically significant variants, contains 2,256,088 records at present, but only 4,062 are SVs. Of these, 458 SVs presented here matched 486 (12.0%) in ClinVar. As expected, benign or likely benign variants have a higher frequency than P or LP variants (Supplementary Table 18). The large cohort and rich medical history allows us to assess the likely clinical impact of these variants and potentially refine the ClinVar classification.
Most ClinVar-annotated pathogenic SVs are very rare (MAF < 0.01%; Supplementary Table 18). One example is a 52-bp deletion on chr. 19: 12,943,750–12,943,802 in the first exon of CALR resulting in a stop gain. This recurrent somatic mutation46,47,48 is listed as pathogenic for primary myelofibrosis and thrombocythaemia is carried by 47 NFE individuals and 1 AFR individual. It strongly associates with measures of platelet distribution; most strongly with platelet width, effect 2.02 s.d. (95% CI = 1.72–2.34, P value = 3.1 × 10−38). It is present in the SNP and indel call set, but is not found in the WES data, despite being exonic.
Although most ClinVar variants are very rare in the UKB some have a higher frequency in the sub-cohorts. One example is a 2,502-bp deletion on chr. 2: 151,645,755–151,648,057 deleting exon 55 of NEB, linked with nemaline myopathy and traced to a single founder mutation49; it is carried by 33 individuals in the cohort, 17 of whom belong to the ASJ cohort. Another example is a 613-bp deletion on chr. 11 : 5,225,255–5,225,868 removing the first 3 exons of HBB seen in 19 individuals all belonging to the SAS cohort. The deletion has been annotated in ClinVar to be clinically significant for β-thalassaemia, and we find it to be associated with a 1.96 s.d. (95% CI = 1.49–2.43, P value = 5.4 × 10⁻¹⁶) decrease in haemoglobin concentration.


