High burden
The top ten neurological conditions by disability-adjusted life year (DALY) globally are shown for 2021. Stroke has more than double the DALYs of any other condition, at 160 million. In 2021, stroke was the third leading cause of death globally, after coronary heart disease and COVID-19.
Uneven impact
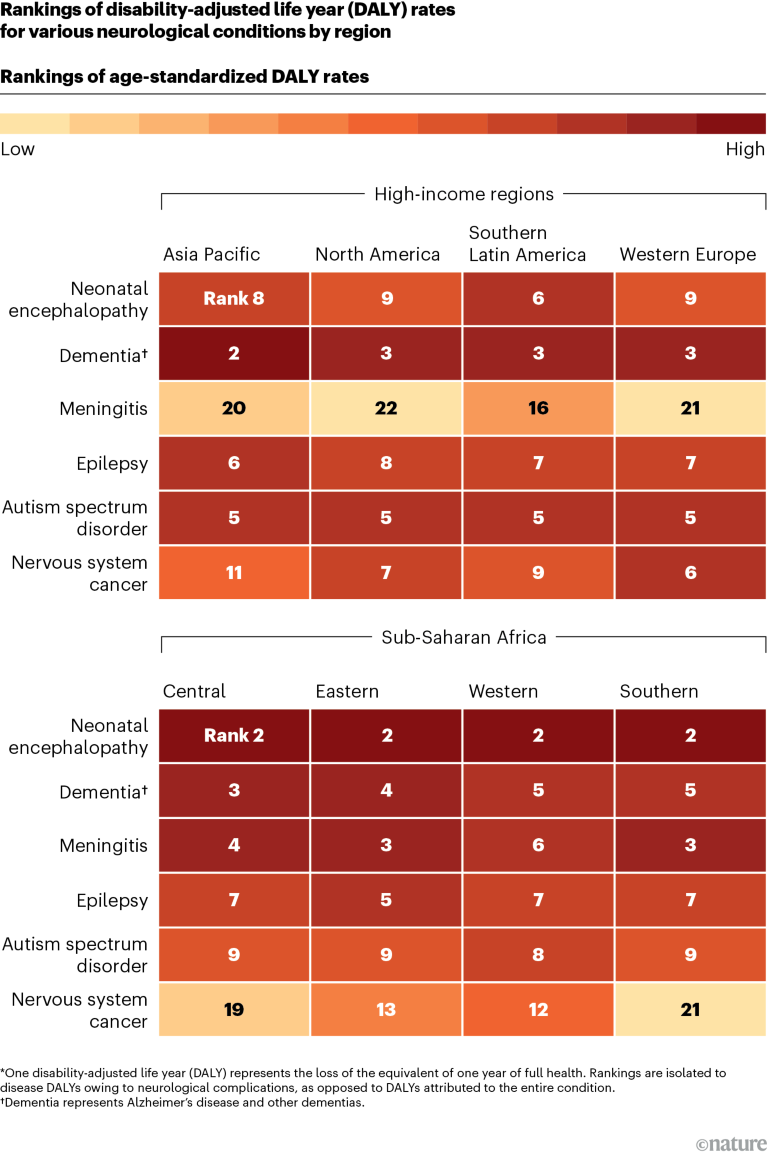
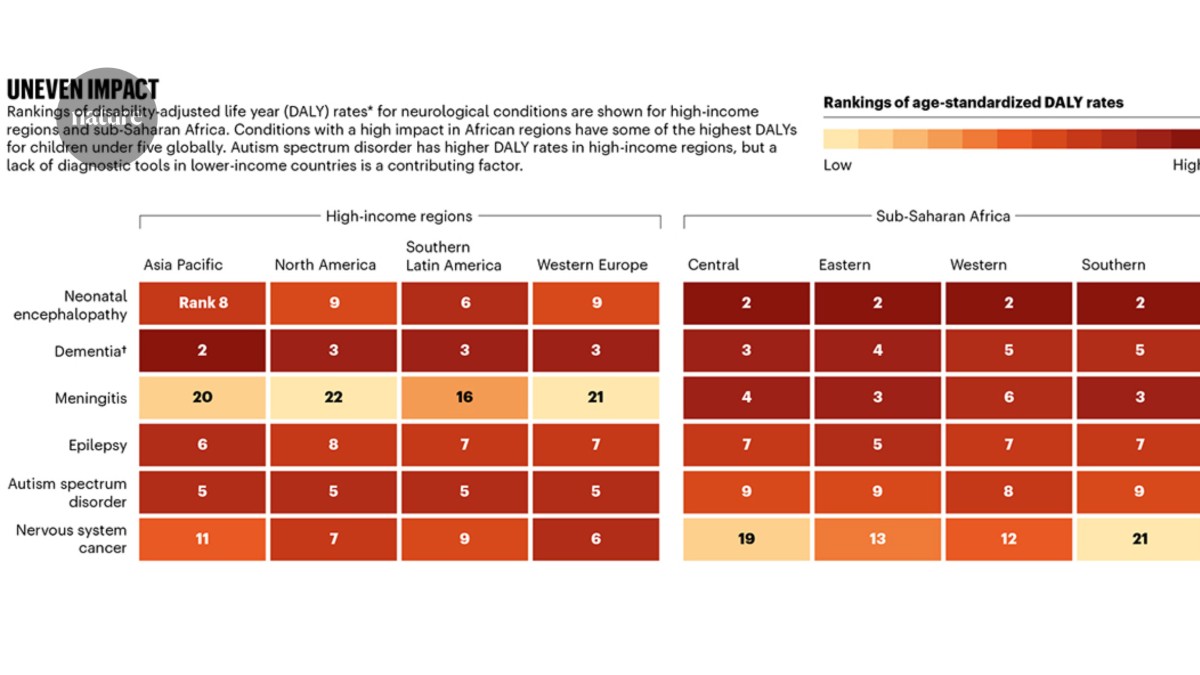
Rankings DALY rates* for neurological conditions are shown for high-income regions and sub-Saharan Africa. Conditions with a high impact in African regions have some of the highest DALYs for children under five globally. Autism spectrum disorder has higher DALY rates in high-income regions, but a lack of diagnostic tools in lower-income countries is a contributing factor.

Source: Steinmetz, J. D. et al. Lancet Neurol. 23, 344–381 (2021). Infographic by Bec Crew and Tanner Maxwell.
Time trend
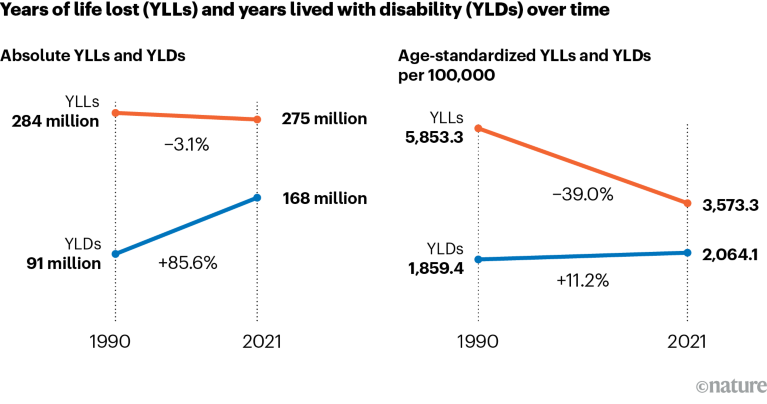
The absolute number of global deaths attributed to neurological conditions has not changed much since 1990, but ageing and growing populations mean there are now more people living with these conditions. When age is standarized — all populations are given the same age structure, so the percentage of people under and over 40 years old is consistent, for example — death rates sharply decline.

Source: Steinmetz, J. D. et al. Lancet Neurol. 23, 344–381 (2021). Infographic by Bec Crew and Tanner Maxwell.
Workforce spread
Europe overwhelmingly leads in the number of neurologists and neurosurgeons per capita. The World Health Organization reports a significant difference between income groups, with low-income countries reporting a median of 0.1 specialists per 100,000 population, compared with a median of 7.1 per 100,000 population in high-income countries. These workplace population numbers are self-reported.


