The computational complexity of quantum systems arises from the exponential growth of the Hilbert space dimension with system size. On near-term quantum processors whose practical complexity is limited by noise, random circuit sampling (RCS) has emerged as the most suitable candidate for a beyond-classical demonstration. The interplay between computational complexity and noise is highlighted by recent RCS experiments with increasing system sizes and fidelity4,5,6,9,10, although classical algorithms have also advanced substantially11,12,13,14,15,16. RCS is, arguably, the entry point into the realm of classically intractable problems for any experimental quantum processing platform17. The reason is that RCS circuits can be optimized to maximize the speed of quantum correlations with iSWAP-like gates2,18,19,20 while preventing potential simplifications in the corresponding classical emulations17. This intensifying quantumâclassical competition motivates two questions. Are there well-defined boundaries for the region where the exponentially large Hilbert space is, in fact, leveraged by a noisy quantum processor? More importantly, can we establish an experimental observable that directly probes these boundaries?
In this work, we provide direct insight to these two questions using RCS on a two-dimensional grid of superconducting qubits. We demonstrate that the interplay between quantum dynamics and noise can drive the system into distinct phases. The boundary between these phases can be resolved using finite-size studies with a fidelity estimation technique called cross-entropy benchmarking (XEB)2,3,4,21. Reaching the desired phase of maximized complexity requires a noise rate per cycle below a critical threshold whose value is determined by the growth rate of quantum correlations.
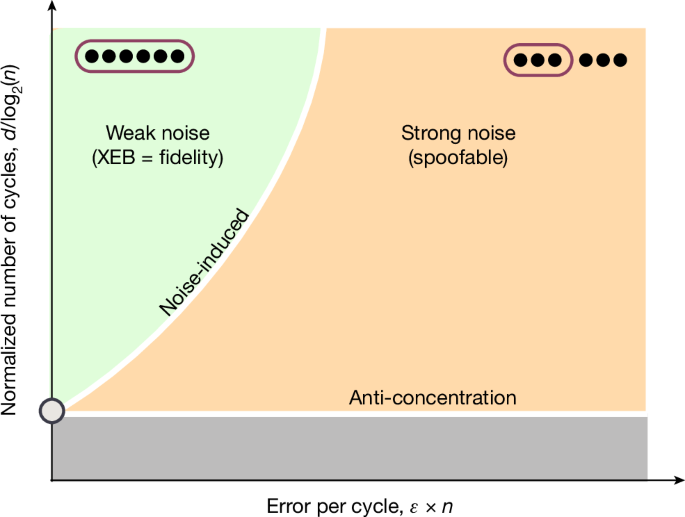
The structure of these phases is schematically illustrated in Fig. 1. Driven by the circuit number of cycles or depth, the system first goes through a dynamical phase transition where the output distribution is no longer concentrated in a fraction of bit strings. Anti-concentration is a key ingredient of XEB and of mathematical arguments on the complexity of simulating noiseless RCS2,22,23,24,25. Nevertheless, we will show that this is a necessary but not sufficient condition for global entanglement (Supplementary Information section H), which maximizes the computational cost.
One phase transition goes between a concentrated output distribution of bit strings from RCS at a low number of cycles to a broad or anti-concentrated distribution. There is a second phase transition in a noisy system. A strong-enough error per cycle induces a phase transition from a regime where correlations extend to the full system to a regime where the system may be approximately represented by the product of several uncorrelated subsystems.
The second transition is driven by noise, specifically the error rate per cycle ϵâÃân, where ϵ is the error per gate and n is the number of qubits. As illustrated in Fig. 1, the behaviour of quantum correlations falls into two regimes: when the error rate per cycle is large, the state of the system can be approximately represented by several uncorrelated subsystems (equation (3)). This leaves the quantum system open to spoofing by classical algorithms that represent only part of the system at a time22,26,27. In the regime where the error rate per cycle is sufficiently low, correlations eventually span the entire system, thus restoring its computational complexity, and the experiment cannot be spoofed (Supplementary Information section F). The boundary between these two phases is determined by the competition between ϵâÃân and the convergence of the system to the ergodic state. Reference 28 studied the same phase transition for one-dimensional and all-to-all connectivity.
We found that XEB is a proper observable and can be used to resolve the aforementioned regimes experimentally, as it is sensitive to the nature of the dominant correlations. Specifically, linear XEB is measured as
$${\rm{XEB}}={\langle {2}^{n}{p}_{{\rm{sim}}}(s)-1\rangle }_{{\rm{s}}},$$
(1)
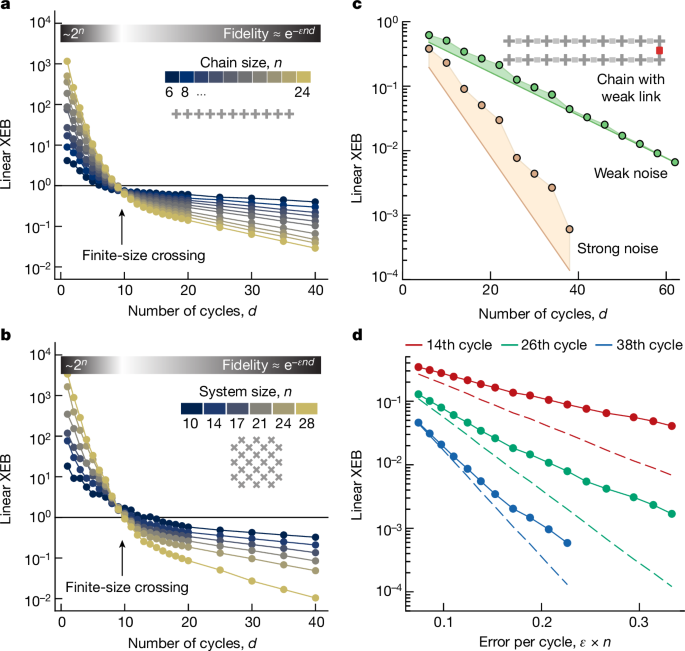
where n is the number of qubits, \({p}_{{\rm{sim}}}(s)\) is the ideal (simulated) probability of bit string s and the average is over experimentally observed bit strings s. We measured XEB as a function of the number of cycles or depth d for different system sizes to resolve the dynamical phase transition (Fig. 1). The experimental results are shown in Fig. 2a,b for one- and two-dimensional systems, respectively. We found that XEB increased with system size for small d. In this case, the system state was concentrated in a fraction of basis states. However, for large d, XEB decayed exponentially and approximated the circuit fidelity. At an intermediate number of cycles, we observed a single crossing point where all the measured XEB curves intersected and where XEB was approximately independent of the system size. The detailed theory presented in Supplementary Information section E shows that this is indeed a phase transition associated with the role of the boundary.
aâd, At a low number of cycles, XEB grows with the size of the system. In a noiseless device, XEB will converge to 1 with the number of cycles. In the presence of noise, XEB becomes an estimator of the system fidelity. a,b, We experimentally observed a dynamical phase transition at a fixed number of cycles between these two regimes in one (a) and two dimensions (b). The random circuits have Haar random single-qubit gates and an iSWAP-like gate as an entangler. c,d, We experimentally probed a noise-induced phase transition using a weak-link model (see the main text), where the weak link is applied every 12 cycles (discrete gate set; see main text). c, The two different regimes. In the weak-noise regime, XEB converges to the fidelity, whereas in the strong-noise regime, XEB remains higher than predicted by the digital error model. d, We induced errors to scan the transition from one regime to the other.
Having identified the minimum number of cycles at which XEB approximated the system fidelity, we formulated an experimental protocol for locating the transition between the strong- and weak-noise regimes (Fig. 1). A conceptually simple set-up that highlights the underlying physics for this transition is the so-called weak-link model, where two subsystems of size n/2 are coupled through an entangling gate applied every T cycles. In the limit where Tâ=ââ (no weak link is applied), the subsystems were uncoupled and the overall system converged to a product state ÏAâââÏB, where ÏA and ÏB are the pure ergodic states of each subsystem. Adding noise, we assumed the so-called depolarizing channel noise model for the density matrix of each subsystem A and B (ref. 29): Fd/2ÏA/Bâ+â(1âââFd/2)IA/B/2n/2, where IA (IB) is the identity matrix and Fâ=âeâϵn is the fidelity. Direct substitution of this density matrix into equation (1) gives XEBâ=âeâϵndâ+â2eâϵnd/2. We use XEBâ=â1 for ÏA/B and XEBâ=â0 for IA/B/2n/2.
At finite yet large T, each subsystem approached the ergodic state in less than T cycles. The application of a two-qubit gate between the two subsystems built global correlations, which, therefore, decreased the XEB term proportional to Fd/2 with some rate λ. This rate λ depends on the gate and was λâ=â1/4 for the iSWAP-like gates employed in our experiment (Supplementary Information section D). Therefore, a simplified model for linear XEB is
$${\rm{X}}{\rm{E}}{\rm{B}}\approx 2{\lambda }^{d/T}{e}^{-\epsilon nd/2}+{e}^{-\epsilon nd}.$$
(2)
We justify this equation by formally averaging circuit instances over two-replicas, which results in the so-called population dynamics formalism (Supplementary Information section D). We probed this behaviour by measuring XEB experimentally as a function of d, as shown in Fig. 2c. We employed a noise-injection protocol that effectively changed the gate fidelities in our quantum circuits (Supplementary Information section C2) and show results corresponding to different noise levels. We used the discrete set of single-qubit gates chosen randomly from ZpX1/2Zâp with pâââ{â1, â3/4, â1/2, â¦, 3/4} and Z and X the corresponding Pauli matrices. We observed that in the weak-noise regime, XEB converged to the expected fidelity of the entire system, Fd. This was because F was sufficiently high such that Fd dominated the contribution to XEB. On the other hand, XEB was significantly above Fd in the strong-noise regime owing to the dominant contribution of 2λd/TFd/2 to XEB. These results exemplify the competition between the exponential decay of global correlations proportional to ϵn and the entangling rate between subsystems (proportional to 1/T in this example).
The transition between the two different noise-induced phases was more clearly seen by fixing d to a few values and varying the effective noise level (F). We observed that XEB exhibits a non-trivial scaling distinct from Fd (Fig. 2d). In particular, the rate of decay with respect to errors decreased at higher error rates. This is also consistent with 2λd/TFd/2 being dominant at high errors.
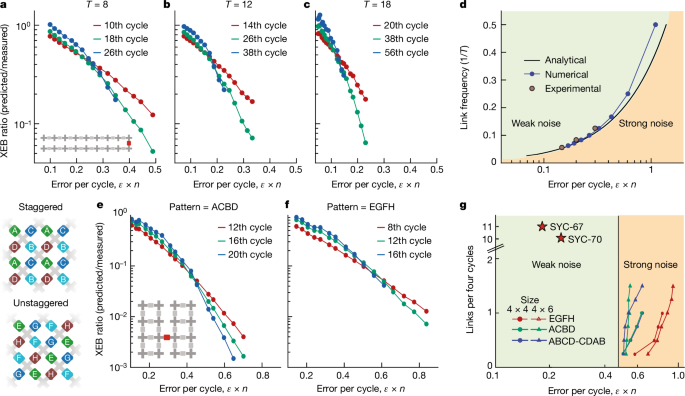
To experimentally locate the critical value of the error per cycle (or equivalently, F) where the dynamical exponent of XEB changed, we defined a modified order parameter Fd/XEB, which is asymptotic to a distinct value of 1 (0) in the weak (strong) noise regime. The transition between the two limits became a discontinuity when dââââ, indicating a phase transition for finite ϵnâââκc, where the critical value κc can be a function of λ and T. In the transition region, we observed the finite-size critical behaviour where Fd/XEB was approximately a function of (ϵnâââκc)d. This was revealed in the order parameter for different numbers of cycles d crossing at a single point, as can be verified from equation (2) and numerically for the circuits used in the experiment. The experimentally obtained Fd/XEB, shown in Fig. 3aâc,e,f, indeed manifested the expected critical behaviour. For ϵnââ²âκc, the order parameter increased as d was increased, whereas for ϵnââ³âκc, the order parameter decreased as d was increased. At the critical point ϵnâââκc, the datasets crossed and the order parameter was approximately independent of d. We attribute the slight drift in the crossing point between different depths to potential systematic errors in the experimental estimation of F.
aâc, Experimental noise-induced phase transitions as a function of the error per cycle for several periods T of the weak-link model (discrete gate set) (Tâ=â8 (a), Tâ=â12 (b) and Tâ=â18 (c)). As T increases, the critical value of noise or error per cycle becomes lower. d, Phase diagram of the transition with analytical, numerical and experimental data. The experimental data were extracted from the crossing of the largest number of cycles scanned. e,f, Experimental transitions in two dimensions with different patterns: staggered ACBD (e) and unstaggered EGFH (f; discrete gate set). g, Numerical phase diagram of the two-dimensional phase transition. We show the critical point for different sizes and patterns. The qubits are arranged as shown in the inset of e. For fixed size, we increased the number of bridges (such as the red coupler in e) until all bridges were applied (four and six for the 4âÃâ4 and 4âÃâ6 systems, respectively), denoted as links per four cycles in g. For all the patterns, we delimited a lower bound on the critical error rate of 0.47 errors per cycle to separate the region of strong noise where XEB failed to characterize the underlying fidelity and where global correlations were subdominant. The experimental results shown in Fig. 4 (SYC-67) and in Supplementary Information section C1 (SYC-70) are represented by red stars, which are well within the weak-noise regime.
We extracted the critical noise rate for different link frequencies 1/T experimentally, numerically and analytically (Fig. 3d). When comparing with the functional form \({\epsilon }n\simeq 4/T\log 2\) predicted by the analytical weak-link model, we observed appreciable deviations when the link frequency approached 1/2, which corresponds to the regular one-dimensional chain. The deviation occurred because the weak-link model was no longer applicable in this regime. A more accurate description is provided by a generalization of this model in Supplementary Information section E1.
To explain the nature of the noise-induced phase transition for two and more dimensions, we extended the weak-link model from two subsystems to a number of subsystems equal to the number of qubits (see Supplementary Information section E2 for details). For depths dââ«â1, the subsystems converge either to an appropriate ergodic state or to a state proportional to the identity matrix, as in the weak-link model. In the noiseless case, there are two stationary configurations, with either all subsystems in the identity matrix or all in the ergodic state. We expanded the noisy state around these two configurations using the so-called dilute flipped spin expansion. This generalizes equation (2) to
$${\rm{XEB}}+1\simeq \sum _{k}\frac{1}{k!}{e}^{-{\epsilon }kd}{({\lambda }^{d}n)}^{k}+\sum _{k}\frac{1}{k!}{e}^{-{\epsilon }(n-k)d}{({\lambda }^{d}n)}^{k}\,,$$
(3)
where the first (second) term on the right-hand side corresponds to the expansion around the identity matrix (ergodic state). See Supplementary Information section D for the derivation. The index k describes the total number of subsystems not equal to the corresponding global state and k! is its factorial. The first term on the right-hand side corresponds to the low-weight Pauli paths approximation in ref. 27. Finally, λâ=â1/4 for the iSWAP gate, as in the weak-link model.
The noise-induced phase transition appears in the thermodynamical limit nââââ at fixed ϵn and \(d/\log n\) (see Supplementary Information section E for details). We found
$${\rm{XEB}}+1\simeq \exp (n{2}^{-2d})(1+{e}^{-{\epsilon }nd}).$$
(4)
The second factor on the right-hand side corresponds to the global fidelity and dominates in the weak-noise regime \({\epsilon }n\ll {\rm{ln}}\,4\). The first factor describes the convergence to anti-concentration (Supplementary Information section E), in accordance with refs. 22,23, and dominates in the strong-noise regime \({\epsilon }n\gg {\rm{ln}}\,4\). In this case, the first term on the right-hand side of equation (3) prevails, and by taking small k, the state can be approximately represented by several uncorrelated subsystems. On the one hand, as captured by equation (3), this transition corresponds to qualitatively different configurations. On the other hand, both regimes correspond to an ordered phase. The noise-induced phase transition is driven by a control parameter (analogous to a magnetic field in an Ising model) that scales with the system size (number of qubits). This is loosely like Fréedericksz transitions in liquid crystals30 and is qualitatively different from the quantum to classical transition discussed in ref. 31. The transition discussed here is a competition between the finite rate of convergence to the overall ergodic state and the fidelity per cycle. The transition in ref. 31 is a competition between local interactions and the error rate per qubit and is related to the error threshold of quantum error correction codes.
The two-dimensional experimental results are shown in Fig. 3e,f for a 4âÃâ4 square grid of qubits and two different circuit structures, whereby the two-qubit gates were applied either in a staggered (Fig. 3e) or an unstaggered (Fig. 3f) fashion. As in one dimension, the 16-qubit system was divided into two halves connected by a single iSWAP-like gate applied every four cycles. For both circuit structures, we observed a similar crossing between Fd/XEB measured at three different cycles, with a higher value of ϵn observed for the unstaggered patterns.
We numerically evaluated critical noise rates for systems of different sizes and circuit structures without weak links, including both the staggered and unstaggered patterns and the ABCD-CDAB pattern used in ref. 4. Here, we used Haar random single-qubit gates (Supplementary Information section D).
The vertical line in Fig. 3g gives a lower bound for the noise-induced phase transition. Furthermore, the noise-induced phase transition for the discrete gate set used in the experiment occurred at higher noise rates (Supplementary Information section F2). We compared this lower bound with the 67-qubit and 70-qubit RCS experiments that we will present next. We obtained the error per cycle by fitting the exponential decay of the fidelity (Fig. 4). It is evident that these experiments fell well within the weak-noise regime, satisfying the requirement to fully utilize the computational capacity of the noisy quantum processors.
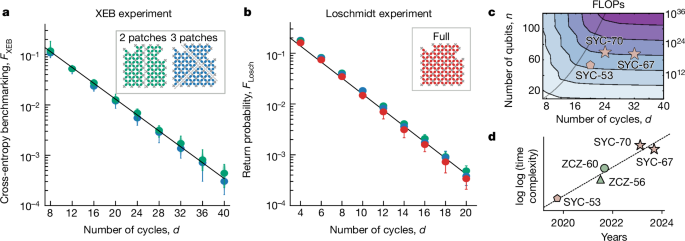
a, Verification of RCS fidelity with logarithmic XEB. The full device is divided into two (green) or three (blue) patches to estimate the XEB fidelity for a modest computational cost. We used the discrete gate set of single-qubit gates chosen randomly from ZpX1/2Zâp with pâââ{â1, â3/4, â1/2, â¦, 3/4}. For each number of cycles, 20 circuit instances were sampled with 100,000 shots each. The solid lines indicate the XEB estimated from the digital error model. b, Verification of RCS fidelity with Loschmidt echo. The inversion was done by reversing the circuit and inserting single-qubit gates. In this case, the Loschmidt echo number of cycles doubled. c, Time complexity estimated as a function of the number of qubits and the number of cycles for a set of circuits. As a working definition of time complexity, we used the number of FLOPs needed to compute the probability of a single bit string under no memory constraints. The solid line indicates the depth at which correlations spread to the full device and the FLOPs with depth go from exponential to polynomial. d, Evolution of the time complexity of the RCS experiments. The dashed line represents doubly exponential growth as a guide for the eye.
We demonstrated beyond-classical RCS by performing an experiment on a 67-qubit Sycamore chip (Fig. 4). These random circuits followed the same two-dimensional ABCD-CDAB pattern as ref. 4. The single-qubit gates were chosen randomly from the discrete set ZpX1/2Zâp with pâââ{â1, â3/4, â1/2, â¦, 3/4}. We show in Supplementary Information section B the fidelity of the elementary operations of the random circuit. On average, we achieved a read-out error of 1.3(0.5)âÃâ10â2, a dressed two-qubit Pauli error rate of 5.5(1.3)âÃâ10â3 that can be further decomposed into a single-qubit Pauli error rate of 1.0(0.5)âÃâ10â3, and an intrinsic two-qubit simultaneous error of 3.5(1.4)âÃâ10â3. An intrinsic Pauli error rate of 3.5âÃâ10â3 corresponds to an average fidelity of 99.72%. We validated the digital error model by looking at patched variations of the random circuit (inset in Fig. 4a), where slices of two-qubit gates have been removed to create patched circuits for which each patch XEB can be verified for a modest computational cost. The total fidelity was then the product of the patch fidelities. Computing XEB over full circuits is, at present, an intractable classical task. We, thus, estimated the fidelity after 32 cycles using the discrete error model, obtaining 0.1%. This increased depth was possible thanks to the substantially reduced errors compared with previous processors. We collected over 70 million sample bit strings for a single circuit at this depth. In Supplementary Information section SC1, we report fidelities for another XEB experiment, SYC-70, done on 70 qubits and with 24 cycles. In Fig. 4b, we verify these extracted fidelities with the Loschmidt echo, where we use the same circuit and its inversion to return to the initial state. We observed good agreement with the XEB experiment and the digital error model.
Finally, we estimated the equivalent classical computational cost of RCS with the tensor network contraction method7,11,12,13,14,15,16,18,32,33,34. With this method, ref. 15 classically sampled the RCS experiment performed in 20194 in 15âh using 512 GPUs. Reference 16 also performed this task with a similar cost. Furthermore, another team computed7 the corresponding XEB, which confirmed the predictions of ref. 4, which is a harder computational task than noisy sampling. Hence, these notable improvements in classical algorithms significantly raised the beyond-classical threshold. For completeness, in Supplementary Information section H, we also study matrix product states, a popular tensor network variational representation of one-dimensional quantum states with limited entanglement35,36,37. We found that given current supercomputer memory constraints, matrix product states failed to reach the experimental fidelity and offered worse performance than tensor network contraction.
We report improvements in tensor network contraction techniques that resulted in lower estimated computational costs for simulated RCS (Supplementary Information section G). Figure 4c shows the time complexity or number of floating-point operations (FLOPs) (the number of real multiplications and additions) as a function of the number of qubits and cycles required to compute a single amplitude at the output of a random circuit without memory constraints, as we are optimizing only the contraction ordering of the underlying tensor network. The time complexity in this context is rigorously defined as the minimum contraction cost achievable in terms of FLOPs per amplitude12, which we approximated by optimizing the contraction ordering. This served as a proxy lower bound for the hardness of both sampling and verification. For a fixed number of qubits and increasing number of cycles, there was a notional crossover in the scaling of the time complexity from exponential to linear. Given a noisy experimental set-up, this implies an optimal number of cycles for the trade-off between computational time complexity and fidelity. Beyond the crossover, fidelity decreases faster than the time complexity increases. The crossover number of cycles is consistent with a scaling \(\sqrt{n}\). A line following the functional form \(d=A\sqrt{n}\), where n is the number of qubits, has been added as a guide to the eye. Note that this is related to the number of cycles at which âtypicalâ entanglement is achieved (Supplementary Information section H) and is a stronger requirement than the anti-concentration of the output distribution. For both 67 and 70 qubits, 24 cycles was deep enough to saturate the exponential growth of this time complexity. Figure 4d shows the growth of the time complexity without memory constraints of the largest RCS experiments run over the last few years.
A practical estimate of the computational resources to simulate RCS needs to take into account the finite FLOPS (FLOPs per second) delivery of a supercomputer as well as its memory constraints and other limitations such as finite bandwidth. Table 1 shows estimates of the runtime for the approximate simulation of the largest instances of RCS from refs. 4,5,6 and the current work when using the state-of-the-art methods discussed in Supplementary Information section G. For these estimates, we considered sampling 1 million uncorrelated bit strings at a fidelity like that of the experiment using the current top-performing supercomputer, Frontier, which performs 1.7âÃâ1018 single-precision FLOPS of theoretical peak performance spread across GPUs with 128âGB of RAM each. This required the computation of 10 million approximate probability amplitudes of uncorrelated bit strings to be used in rejection sampling18. Despite notable progress in achieving tensor contraction algorithms that are embarrassingly parallelizable over each GPU14,32, we found that this technique broke down for the much deeper SYC-67 circuits with 32 cycles given the tight memory constraints. As a result, an estimated lower bound for the sampling cost became substantially more prohibitive. Assuming a distributed use of all RAM and under the unrealistic assumption of negligible bandwidth constraints, the computational cost was around 1âÃâ104âyears (Table 1). In the untested case in which we expanded working memory to all secondary storage and still ignored the bandwidth, we obtained an estimate of 12âyears.
In conclusion, our experiment provides direct insights on how quantum dynamics interacts with noise. The observed phase boundaries lay out quantitative guidance to the regimes where noisy quantum devices can properly leverage their computational power. In addition, we present new RCS results with an estimated fidelity of 1.5âÃâ10â3 at 67 qubits and 32 cycles or 880 entanglement gates, corresponding to more than doubling the circuit volume compared to ref. 4 for the same fidelity. Global correlations dominate XEB in the weak-noise phase, which protects RCS against âspoofingâ attacks, in contrast to boson sampling38, where all known metrics for recent experiments39,40,41 are dominated by local correlations42. Looking forward, despite the success of RCS in quantifying the available coherent resources, finding practical applications for near-term noisy quantum processors still remains an outstanding challenge. Certified randomness generation43,44 could be a promising candidate for such an application (Supplementary Information section I).


