In a straight line, a car will obviously beat a bus or car in a race, but when it comes to commuting across town the result can be much closer. To show just how close those races can get in busy cities, a Finnish geographer has plotted journeys by bus, car and bike on a series of mesmerizing maps.
The maps were created as part of a series called Accessibility Fireworks, because they really do look like Fourth Of July fireworks exploding out from town centers. They were made by Finnish geographer Topi Tjukanov and they’re part of a whole series of fascinating maps about mass transit that he’s designed.
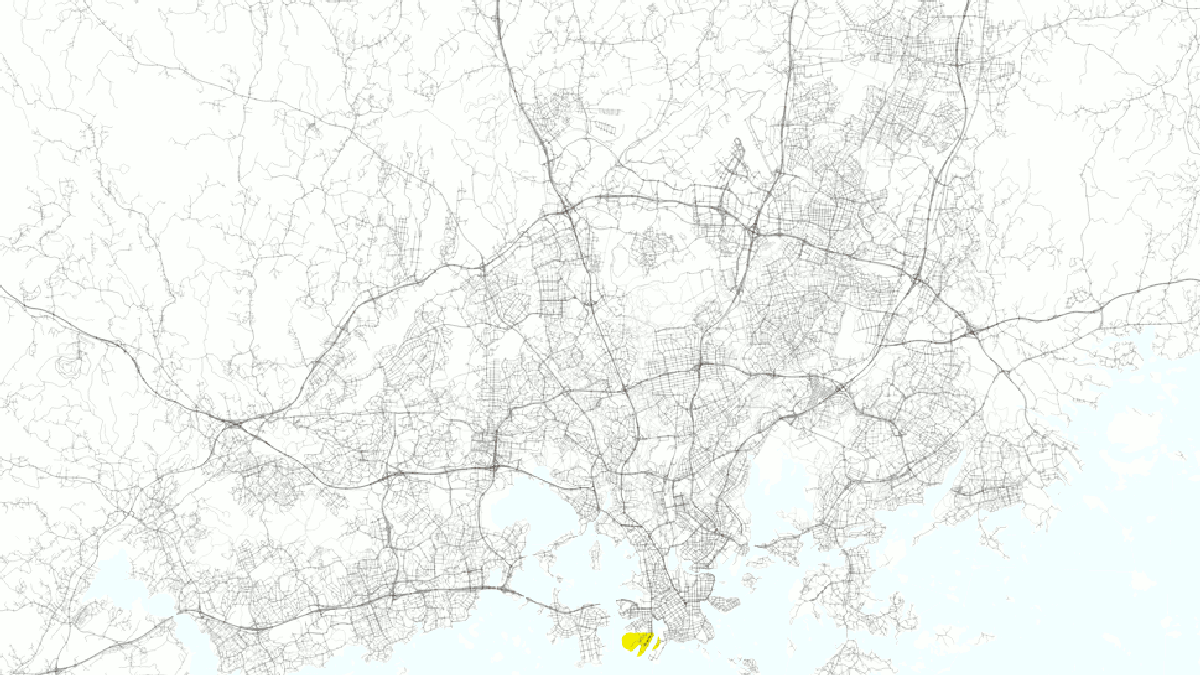
Each of the maps shows how long it takes to travel from the city center out to the suburbs either in a car, on a bike or using public transport. Every frame represents one minute of travel time and dots of different colors represent the distances traveled by each mode of transportation.
Using publicly available data, Tjukanov plotted journeys from Helsinki’s West Harbor starting at 8 a.m. The pink color represents private car travel, yellow is bicycle journeys and green is mass transit. Quickly, the map is filled with pink within a little over an hour of travel time. Yellow follows, filling the space in under two hours, before the map is all green by around 10:40 a.m.
In the second, the journeys start from the city’s Kallio district at 4 p.m. and race from there, with the car again finishing its journeys quickest. In the second map, however, journeys made by bike and public transport are much more closely matched.
Obviously, the maps show off a very different split in journey times than you’d find in similarly-sized cities here in America. In Finland, 60 percent of commuters get to work by car, 27 percent use public transport and 21 percent cycle, according to figures from Statista. This means infrastructure like separate bike lanes, bus lanes and functional public transport are commonplace and easy to use by residents.
In contrast, the Bureau of Transportation reports that more than 68 percent of American commuters drive themselves to work, 0.46 percent cycle and just three percent take public transport.


