


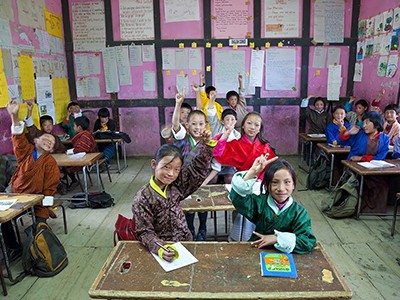
Unpaid work, such as volunteering at a food bank, does not typically count towards gross domestic product. Credit: Getty
For decades, economists have known that using gross domestic product (GDP) alone to guide policy is problematic. The metric is mainly a measure of market production, albeit one with strong marketing and branding, and misses key elements of what makes a good life. Nevertheless, failure to agree on alternatives has held back the debate over what should replace it.
Beyond growth — why we need to agree on an alternative to GDP now
This year will be pivotal for changing how policymakers use data to guide decision-making. In May 2025, the United Nations secretary-general António Guterres commissioned a High-Level Expert Group to consider alternatives to GDP. The group’s final report is expected by the end of April and will stimulate great debate about how countries will use its proposed alternatives.
While the world awaits those recommendations, it is worth reflecting on three questions: why is GDP a poor metric, do the data exist to deliver improvements and how could better metrics provoke better policies?
Here, we offer insights from UK efforts to build on GDP to measure economic welfare using readily available national statistics and standard economic tools1. These inclusive metrics show, for example, how UK consumers are more dependent than previously thought on goods and services that are excluded from GDP, and they highlight the importance of social and environmental capitals for national resilience.
Challenges with GDP
GDP faces two main criticisms. First, its methodology means that it is slow to update and reflect the rapidly changing structure of modern economies. All countries need to agree updates to the methodology through a formal UN process: the System of National Accounts (SNA). This is designed to provide a comprehensive, comparable, consistent and standardized accounting system for measuring economic activity across countries and is revised on a cycle of roughly 15 years — the last revision concluded in 2025. Thus, rapidly emerging issues, such as artificial intelligence, can reach a state of maturity before the relevant manuals are refreshed.
The second criticism concerns the SNA’s definition of economic activity. For goods or services to be counted by the SNA as production, and feature in GDP, a person must have been involved in producing them. This can be achieved directly (by using labour to create value) or indirectly (by using capital, which itself must have been created by labour or capital). Ultimately, all production results from current or previous labour by humans.
Putting nature on the balance sheet: how to account for the ecological costs of our actions
Furthermore, by default, another human needs to verify that this production has value through a ‘meaningful economic transaction’: by purchasing the product at a market price or by a government deciding it is worth paying for through taxes. For example, timber harvested by forestry workers counts as production because people are involved in chopping and processing the wood, and its value is established when it is sold to sawmills or to other buyers.
But this narrow human focus means that GDP has two major gaps.
The first is when a human produces a service, but no economic transaction occurs. Cooking a family meal does not count as production because no payment is made, even if the food has more nutritional value than a takeaway meal, the purchase of which is included in GDP. Outputs of unpaid household activity are rising in many countries, along with numbers of part-time workers and retired people.
The second is when no human is involved in production. For example, a tree’s sequestration of carbon and release of oxygen are not recorded in GDP, even though they have or create value to people, and the same activity would carry a price if produced by a human or an operated machine. Similarly, natural water purification, pollination and climate regulation are missing from national accounts.

Why we need to measure people’s well-being — lessons from a global survey
Natural assets such as forests, for example, might be partially counted when they produce goods that enter the market, such as timber, but their broader value, such as biodiversity, carbon storage and flood prevention, is not reflected. Similarly, the fall in value of these benefits, owing to the degradation of natural assets, is excluded from GDP and national accounts.
Failing to account for most of nature and environmental degradation makes GDP a misleading indicator of long-term progress and sustainability, which economist Partha Dasgupta highlighted in a 2021 report2. Recognizing the SNA’s limitations is becoming increasingly urgent as the impact of humans on the planet grows and with changes to working patterns.
In the United Kingdom, around one-third of all goods and services consumed fall outside GDP, either because they are offered by the environment or are made in the home. Economists can no longer avoid this fact. More-inclusive metrics are needed to provide a more comprehensive picture of welfare.
Towards inclusive accounts
Since 2017, the UK Office for National Statistics (ONS) has been testing how far the SNA’s tried and tested methods can be extended using data sets and frameworks that are already in existence. The aim is to produce a more-inclusive set of national income and wealth accounts that better capture where goods and services are being created in modern societies. Here, we report on progress.
Our starting point was reviewing how the SNA defines the creation of value, by considering labour and various forms of capital as inputs to produce output. The first issue we described was how the majority of a nation’s capital is excluded from its national accounts3. For example, in the United Kingdom, only £12.9 trillion (US$17.2 trillion) of a total asset value of £39.7 trillion was recorded in the accounts underlying GDP figures in 2022.

Time spent commuting can be included in inclusive metrics that expand on GDP. Credit: Atlantide Phototravel/Getty
Specifically, four classes of capital stock are excluded from national accounts: human capital (such as education, skills and health); several intangible capitals (such as organizational capital and training); household durables (such as fridges, freezers, washing machines, home computers and cars); and natural capital not involved in conventional production (such as wetlands, forests and biodiversity). These exclusions create a distorted picture of economic strength and sustainability.
To derive inclusive income and wealth accounts, we considered all the goods and services that households receive, not just those that are purchased. We built on a generation of data-development work across the UK statistical system, sourcing data for paid activities from the ONS national accounts and for unpaid household work from the ONS Household Satellite Account (for which 2023 is the latest data).
This satellite account uses an array of methodologies to calculate the value of unpaid household work; wherever possible, it measures the output of a service produced by a household (such as distances covered by transport services) and multiplies this by a market price (such as the average price per kilometre of a taxi journey). This approach provides a fuller view of household welfare and production than is captured by market‑centric GDP alone.

Bring science into business schools to train the leaders of tomorrow
The ONS natural capital accounts give us information about the environmental benefits that people receive in their everyday lives. These accounts are built by combining data on what is physically happening in the environment (for example, on air quality and carbon emissions) with methods that estimate the value of the services that nature provides, such as cleaner air or carbon stored in forests. Including this information helps to reflect the environmental contributions to people’s well-being that aren’t bought or sold in markets .
A strength of this approach is that it can be implemented largely with existing data; many countries already collect the core elements that feed into national accounts, including basic environmental statistics and periodic surveys on how people allocate their time. The methods are also covered by internationally consistent guidance: the SNA, the UN System of Environmental-Economic Accounting (SEEA) and the UN Economic Commission for Europe’s Guide on Measuring Human Capital. This means that countries can build inclusive income and wealth measures without major new investment, and extend coverage as their data improve.
Fresh perspective
Inclusive income and wealth accounts can produce parallels for any of the monetary aggregates produced by standard national accounting. Here, we focus on two that can be easily compared with GDP — gross inclusive income (GII) and net inclusive income (NII) (see ‘Inclusive accounting metrics’ and ‘Calculating inclusive income’). These broader perspectives highlight the hidden costs of growth strategies that focus solely on market transactions.
First, the United Kingdom’s view of itself as mainly a market economy is challenged by inclusive accounting. In 2023, UK GII per person was around £66,000, compared with around £40,000 per person for GDP1. Around 39% of all goods and services consumed by households, therefore, were omitted from GDP.
Put another way, just under half (49.6%) of all goods and services produced and consumed in the United Kingdom in 2023 came from the market: the rest stemmed from government and other unpaid household and ecosystem services. That market-sector proportion is less than the 53% share in the period 2005–07, suggesting that the balance of the economy has shifted over the past two decades.

Source: ONS