


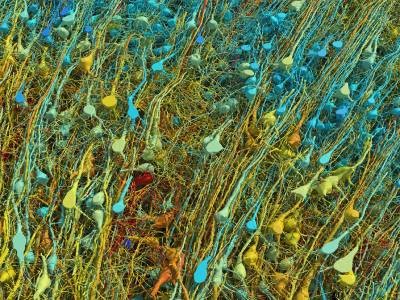
Different regions of the human brain (artificially coloured) have different densities of the energy-producing organelles called mitochondria.Credit: Alfred Pasieka/Science Photo Library
Scientists have created the first map of the crucial structures called mitochondria throughout the entire brain ― a feat that could help to unravel age-related brain disorders1.
The results show that mitochondria, which generate the energy that powers cells, differ in type and density in different parts of the brain. For example, the evolutionarily oldest brain regions have a lower density of mitochondria than newer regions.
The map, which the study’s authors call the MitoBrainMap, is “both technically impressive and conceptually groundbreaking”, says Valentin Riedl, a neurobiologist at Friedrich-Alexander University in Erlangen, Germany, who was not involved in the project.
From cell to brain
The brain’s mitochondria are not just bit-part players. “The biology of the brain, we know now, is deeply intertwined with the energetics of the brain,” says Martin Picard, a psychobiologist at Columbia University in New York City, and a co-author of the study. And the brain accounts for 20% of the human body’s energy usage2.
Wielding a tool typically used for woodworking, the study’s authors divided a slice of frozen human brain ― from a 54-year-old donor who died of a heart attack ― into 703 tiny cubes. Each cube measured 3 × 3 × 3 millimetres, which is comparable to the size of the units that make up standard 3D images of the brain. “The most challenging part was having so many samples,” says Picard.
Cubic millimetre of brain mapped in spectacular detail
The team used biochemical and molecular techniques to determine the density of mitochondria in each of the 703 samples. In some samples, the researchers also estimated the mitochondria’s efficiency at producing energy.
To extend their findings beyond a single brain slab, the authors developed a model to predict the numbers and types of mitochondria across the entire brain. They fed it brain-imaging data and the brain-cube data. To check their model, they applied it to other samples of the frozen brain slice and found that it accurately predicted the samples’ mitochondrial make-up.