Oxidation mechanisms
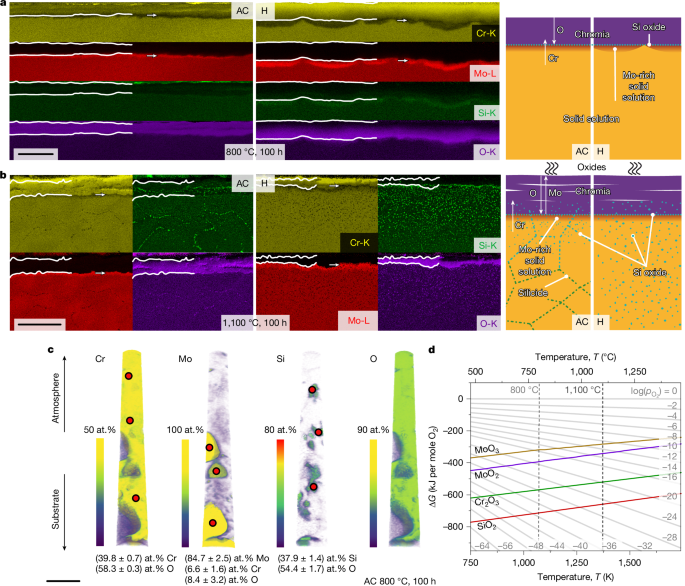
When oxidized, corundum prototype (Strukturbericht designation D51; Extended Data Fig. 4) Cr2O3 was verified by XRD and scanning electron microscopy energy-dispersive X-ray spectroscopy (SEM-EDS) for all scales examined in this study. For the Si-containing Cr-36.1Mo-3Si, a continuous, well-adherent oxide layer of uniform thickness (Fig. 3a) was obtained for AC and H oxidized at 800 °C for 100 h. The scale thicknesses are (1.7 ± 0.3) and (3.9 ± 2.4) µm (Extended Data Fig. 6d), respectively. This is in strong contrast to the porous, layered microstructure shown in Extended Data Fig. 5 with a total thickness of (91 ± 24) µm formed on the Si-free Cr-37.2Mo under the same conditions. On the basis of the thickness, the area-specific mass gains by the Cr2O3 growth \(\frac{{\Delta m}^{{\rm{scale}}}}{A}\) (Extended Data Fig. 6d) can be estimated. The scale growth accounts for specific mass gain of (+0.9 ± 0.2) or (+2.0 ± 1.2) mg cm−2 in Cr-36.1Mo-3Si AC and H, respectively, and is thus similar to the experimentally obtained \(\frac{{\Delta m}^{\text{exp}}}{A}\) of (+0.01 ± 0.03) and (+0.00 ± 0.03) mg cm−2. A slight mass loss by MoO3 evaporation in the transient stage of oxidation is unavoidable; however, it does not affect the long-term behaviour of the alloy. By contrast, the substantial difference between the expected \(\frac{{\Delta m}^{{\rm{scale}}}}{A}=(+47\pm 12)\,{\rm{mg}}\,{{\rm{cm}}}^{-2}\) and the negative experimental \(\frac{{\Delta m}^{\text{exp}}}{A}=(-5.6\pm 0.4)\,{\rm{mg}}\,{{\rm{cm}}}^{-2}\) indicate considerable MoO3 evaporation in the case of Cr-37.2Mo. As well as the mass-change observations, the analysis of scale thicknesses at intermediate times allows for an assessment of the growth kinetics (Extended Data Fig. 6). Consistent with the MoO3 evaporation and the porous, non-protective oxide scale on the Si-free Cr-37.2Mo, a linear scale growth behaviour is obtained. In accordance with the pronounced reduction of the evaporation, the Si-containing Cr-36.1Mo-3Si exhibits a parabolic Cr2O3 growth, with (15 ± 10) × 10−14 and (5.9 ± 1.6) × 10−14 cm2 s−1 for AC and H, respectively. This proves a diffusion-controlled growth of a passivating scale on Cr-36.1Mo-3Si at 800 °C.
a, SEM-EDS (left) and schematic (right) scale structure for oxidation at 800 °C. b, SEM-EDS (left) and schematic (right) scale structure for oxidation at 1,100 °C. c, Atom probe tomography from the substrate–scale interface for oxidation at 800 °C (only AC condition). d, Ellingham diagram with Gibbs free energy of formation (ΔG) per mole O2 as a function of temperature. Scale bars, 5 μm (a); 50 μm (b); 50 nm (c).
The formation of Cr2O3 is associated with substantial Cr outward diffusion causing a Mo enrichment of the subscale region. This is detected by SEM-EDS and also by XRD. The oxide scales formed on Cr-36.1Mo-3Si after 100 h at 800 °C are thin enough to examine the subscale substrate regions. Two markedly different peaks can be detected (Extended Data Fig. 4). The lattice parameters of 3.125 and 3.138 Å correspond to Mo contents of about (90 ± 2) and (96 ± 2) at.% in AC and H, respectively16. As Mo is insensitive to N uptake, the Mo enrichment below the oxide scale acts as a barrier against nitridation, as confirmed for other Cr–Mo–Si alloys12,24.
In ref. 12, a thin Si oxide layer on solid solution regions of the two-phase alloy had been identified by transmission electron microscopy. As SEM-EDS did not reveal sufficient evidence of Si oxide formation in Fig. 3a, targeted atom probe tomography was performed (Fig. 3c). The upper part of the reconstruction is within the oxide layer and composed of Cr2O3. Towards the substrate and consistent with the other investigations, isolated Mo-enriched solid solution particles are found. A non-negligible O content was detected in these particles; however, no oxidation of Mo to MoO3 takes place. Apart from this, SiO2 is verified within Cr2O3; see the quantifications in Fig. 3c.
In summary, the relevant features identified for oxidation resistance at 800 °C according to Fig. 3a are: (1) the thin, continuous Cr2O3; (2) the Mo-enriched subsurface layer; and (3) the formation of SiO2 at the interface.
A beneficial influence of Mo on the oxidation resistance of Cr alloys has been observed previously in entirely intermetallic Cr-30Mo-30Si consisting of Cr3Si and Cr5Si3 (ref. 24) and in the Mo-lean, two-phase Cr-7Si-2Mo consisting of a (Cr,Mo,Si) solid solution matrix and (Cr,Mo)3Si (ref. 14). From the results in ref. 24, it was concluded that Mo addition to Cr–Si alloys promotes the formation of SiO2, consistent with the present study. For Cr-7Si-2Mo, specific mass gains after 100 h at 1,200 °C are slightly reduced to +5.5 mg cm−2 compared with +8 mg cm−2 for a Mo-free reference alloy with the composition Cr-9Si (ref. 14). A solid solution layer with an increased Mo content is observed underneath the Cr2O3 top layer. The Mo-enriched region is free of nitridation, whereas Cr2N is detected below the Mo-enriched zones14. This is strictly not the case for Cr-36.1Mo-3Si in the present investigation.
The SEM-EDS maps of the scales on Cr-36.1Mo-3Si after oxidation at 1,100 °C for 100 h are shown in Fig. 3b. Continuous white lines mark the outer Cr2O3, with a total thickness of (21 ± 6) and (14 ± 4) µm in AC and H, respectively. Scale adhesion at the interface between the substrate and the oxide scale is obtained, without buckling or cracks being observed. However, the oxidation leads to a complex layered outer Cr2O3 scale. The scale growth is approximately parabolic, with (9.3 ± 3.5) × 10−12 or (6.3 ± 1.4) × 10−12 cm2 s−1. The rate constants are similar to the reported value of (1.1 ± 0.3) × 10−12 cm2 s−1 on two-phase Cr-32.2Mo-13.5Si (ref. 12). However, the estimated specific mass change by scale growth \(\frac{{\Delta m}^{{\rm{scale}}}}{A}\) after 100 h would be (+11 ± 3) or (+7.3 ± 3.6) mg cm−2 compared with the experimental \(\frac{{\Delta m}^{\text{exp}}}{A}\) of (−3.5 ± 0.4) and (1.1 ± 0.6) mg cm−2 for AC and H, respectively. Thus, the scale is not protective and slow but strong evaporation occurs.
Consistent with ref. 15, the outer Cr2O3 seems to be free of SiO2 and originates from Cr-diffusion-controlled outward scale growth. Closer to the substrate, SiO2 particles are frequently obtained within Cr2O3, indicating O-diffusion-controlled inward growth of the scale. Below the scale, the Mo-enriched region is marked in the elemental maps (arrow). Internal corrosion is observed up to 60 µm deep into the substrate with Si-enriched and O-enriched particles, probably SiO2. For both microstructural conditions, intragranular Si oxide is found, although its proportion is smaller in AC owing to the finer grain size. The observation of SiO2 formation agrees with results obtained for the oxidation of Cr–Si alloys at 1,200 and 1,300 °C (refs. 9,15,25). Assuming that internal oxidation is only caused by Si oxidizing to SiO2, the partial pressure \({p}_{{{\rm{O}}}_{2}}\) can be estimated from the Si and SiO2 equilibrium to \({p}_{{{\rm{O}}}_{2}}\approx {10}^{-24}\,{\rm{Pa}}\) (Fig. 3d). The Si enrichment at grain boundaries deeper in the substrate Cr-36.1Mo-3Si AC is because of the formation of (Cr,Mo)3Si particles as Si solubility decreases to low temperatures15. Thermal cycling from RT to 1,100 °C enables the formation of (Cr,Mo)3Si under the presence of nucleation sites such as grain boundaries.
The essential features of the schematic scale structure in Fig. 3b are: (1) the layered Cr2O3 scale; (2) the Mo-enriched layer just below the scale; (3) the Si oxide layer at the interface, as well as particles in subsurface regions.
Figure 3d depicts the Ellingham diagram for the relevant oxides, MoO3, MoO2, Cr2O3 and SiO2. The formation of protective Cr2O3 competes with the formation of non-protective MoO2 and MoO3. This competition is determined by the \({p}_{{{\rm{O}}}_{2}}\), which is established at the scale surface and decreases towards the substrate. The obvious protective effect of the Si addition is the further formation of SiO2 closer to or even within the substrate. The presence of SiO2 accordingly keeps \({p}_{{{\rm{O}}}_{2}}\) low enough to promote a preferred oxidation of Cr rather than of Mo.
The scale mock-up obtained after 100 h of cyclic oxidation at 800 °C seems simple enough to quantitatively assess the effect of Si on the preferential oxidation of Cr. The oxidation of Cr atoms becomes accessible by the scale thickness dscale and the specific mass gain associated with the scale growth \(\frac{{\Delta m}^{{\rm{s}}{\rm{c}}{\rm{a}}{\rm{l}}{\rm{e}}}}{A}\approx \frac{{\Delta m}_{{\rm{O}}\,{\rm{i}}{\rm{n}}\,{{\rm{C}}{\rm{r}}}_{2}{{\rm{O}}}_{3}}^{{\rm{s}}{\rm{c}}{\rm{a}}{\rm{l}}{\rm{e}}}}{A}=\frac{{3M}_{{\rm{O}}}}{{M}_{{{\rm{C}}{\rm{r}}}_{2}{{\rm{O}}}_{3}}}\,{\rho }_{{{\rm{C}}{\rm{r}}}_{2}{{\rm{O}}}_{3}}\,{d}^{{\rm{s}}{\rm{c}}{\rm{a}}{\rm{l}}{\rm{e}}}\). The difference between \(\frac{{\Delta m}^{{\rm{scale}}}}{A}\) to the experimentally obtained \(\frac{{\Delta m}^{{\exp }}}{A}\) allows for the assessment of mass loss by evaporating species \(\frac{{\Delta m}^{{\rm{vap}}}}{A}\), for example, MoO3 with \(\frac{{\Delta m}^{{\rm{vap}}}}{A}\approx \frac{{\Delta m}_{{\rm{Mo}}\,{\rm{in}}\,{{\rm{MoO}}}_{3}}^{{\rm{vap}}}}{A}\) (ref. 26). In this treatment, contributions by the oxidation of Si to SiO2, porosity of the scale as well as other evaporating species such as CrO3 (not expected for <900 °C (ref. 27)) are neglected:
$$\frac{{\Delta m}^{\exp }}{A}\approx \frac{{\Delta m}_{{\rm{O}}\,{\rm{i}}{\rm{n}}\,{{\rm{C}}{\rm{r}}}_{2}{{\rm{O}}}_{3}}^{{\rm{s}}{\rm{c}}{\rm{a}}{\rm{l}}{\rm{e}}}}{A}-\frac{{\Delta m}_{{\rm{M}}{\rm{o}}\,{\rm{i}}{\rm{n}}\,{{\rm{M}}{\rm{o}}{\rm{O}}}_{3}}^{{\rm{v}}{\rm{a}}{\rm{p}}}}{A}$$
(1)
The ratio of oxidized Cr to Mo ions is then:
$$\frac{{n}^{{\rm{o}}{\rm{x}}{\rm{C}}{\rm{r}}}}{{n}^{{\rm{o}}{\rm{x}}{\rm{M}}{\rm{o}}}}=\frac{{2M}_{{\rm{M}}{\rm{o}}}\,{\rho }_{{{\rm{C}}{\rm{r}}}_{2}{{\rm{O}}}_{3}}\,{d}^{{\rm{s}}{\rm{c}}{\rm{a}}{\rm{l}}{\rm{e}}}}{{3M}_{{\rm{O}}}\,{\rho }_{{{\rm{C}}{\rm{r}}}_{2}{{\rm{O}}}_{3}}\,{d}^{{\rm{s}}{\rm{c}}{\rm{a}}{\rm{l}}{\rm{e}}}-{M}_{{{\rm{C}}{\rm{r}}}_{2}{{\rm{O}}}_{3}}\frac{{\Delta m}^{\exp }}{A}}$$
(2)
For the oxidation-resistant Cr-36.1Mo-3Si tested at 800 °C, the assessment yields \(\frac{{n}^{{\rm{oxCr}}}}{{n}^{{\rm{oxMo}}}}\) of (5.4 ± 1.1) and (4.3 ± 0.6) for AC and H, respectively. This is substantially higher than the Cr to Mo ratio of 1.7 provided by the alloy. This indicates the preferential oxidation of Cr over Mo. By contrast, only (2.6 ± 0.3) is obtained for the Si-free Cr-37.2Mo. The preference for oxidation of metal ions is, thus, strongly shifted towards Cr by the presence of only 3 at.% Si.
Deformation mechanisms
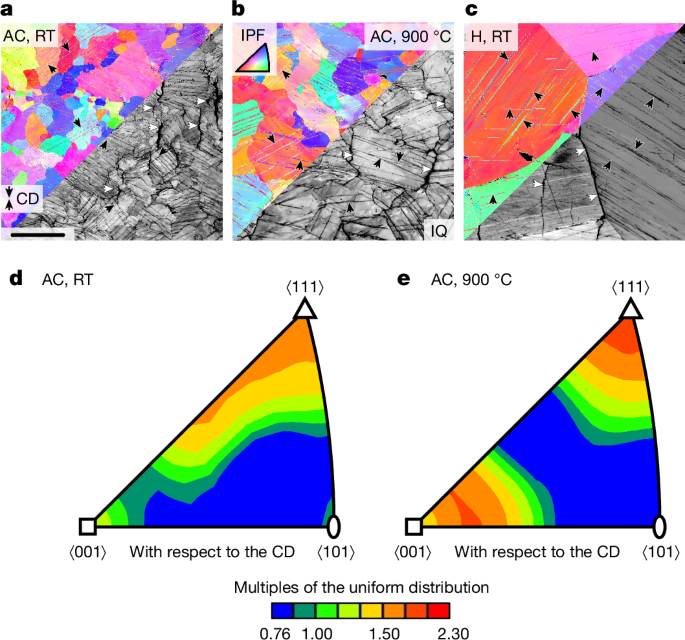
Figure 4a–c shows orientation imaging microscopy maps on longitudinal sections of Cr-36.1Mo-3Si deformed at RT and 900 °C up to plastic strains of approximately 6% in compression. Colour-coded maps indicate crystallographic orientation with respect to the compression direction (CD), greyscale maps yield the diffraction pattern quality. Quantitative assessments of the crystallographic orientations in Fig. 4d,e reveal slightly preferred ⟨100⟩/⟨111⟩ directions parallel to the CD. This is caused by the slip plane normal rotation towards the CD by the dislocation slip in the ⟨111⟩ direction on \(\{1\bar{2}1\}\) to \(\{1\bar{3}2\}\) planes28.
a, AC tested at RT. b, AC tested at 900 °C. c, H tested at RT. The colour code in the orientation maps corresponds to the inverse pole figure (IPF) of the CD. The greyscale image parts highlight diffraction pattern quality (IQ). Black arrows indicate deformation twins and white arrows indicate longitudinal cracks along grain boundaries. d,e, Orientation distribution function presented in the IPF of the CD in multiples of the uniform distribution. Scale bar, 200 μm (a).
Besides dislocation-mediated plasticity, deformation twinning is observed as an alternative deformation mechanism. In most grains, several twin systems are activated. Without exception, all identified twin systems are of \(\{112\}\langle 11\bar{1}\rangle \) type (Extended Data Fig. 7) and correspond to rotations of \(({60}_{-2.9}^{+0.0})^\circ \) about ⟨111⟩ as the common twin system in bcc metals and alloys29. The number density of twins is much lower at 900 °C compared with at RT. Furthermore, the twin lath thickness is larger at 900 °C. Deformation twinning is active regardless of the microstructural condition of Cr-36.1Mo-3Si, that is, AC or H.
The observation of deformation twins coincides with the serrations occurring in compression testing. In contrast to continuous deformation through dislocation slip, entire laths are discontinuously formed during each twinning event, leading to stress drops. However, microcracks are also observed predominantly oriented parallel to the CD. These cracks originate from a limited compatibility of large grains to transversal thickening as well as from stress concentration at terminations of twin laths30,31. The role of grain boundaries for premature crack formation in tensile tests needs to be clarified in future studies.
Deformation twinning usually complements dislocation slip as a process for plastic deformation. It is furthermore considered to be a low-temperature and/or high-strain-rate process. Stresses required for twinning are usually larger than for dislocation slip. Thus, the latter is the more commonly observed elementary process of initiation of plastic deformation in bcc metals and alloys. However, there are frequent reports also for deformation twinning in bcc refractory metals and alloys, for example, Mo (refs. 32,33), Cr (ref. 34), V (ref. 35), W (ref. 36), Nb (refs. 37,38), Ta (ref. 39), Cr-35Fe (ref. 34), Cr–Re (refs. 34,40), Mo-35Re (ref. 41) and Nb–V (refs. 20,42), in polycrystalline33,34,35,38,39,40,41,43 or single-crystalline32,36,37,41 conditions. As the two fundamental deformation mechanisms complement each other depending on the internal stress level, a complex interdependence of intrinsic and extrinsic parameters determines their activation, for example: (1) solid solution strengthening; (2) grain size; (3) temperature (and strain rate); and (4) work hardening.
(1) Deformation twinning is often reported in bcc solid solutions rather than pure metals, potentially because of increasing onset stress for dislocation slip by solid solution strengthening. Reid and Gilbert34 reported no twinning for Cr-4.9Re and Cr-15.2Re but did for Cr-35Re. Similarly, ref. 41 reported deformation twinning in Mo-35Re but not in Mo. Owing to the large difference in lattice parameter and the large shear moduli for Mo and Cr, a beneficial influence of solid solution strengthening on the activation of deformation twinning is plausible44.
(2) Available data for polycrystalline Mo (ref. 33), Cr (ref. 34), V (ref. 35) and Cr-15Re (ref. 40) indicate a smaller twinning stress with increasing grain size (the literature also reports counterexamples, in which twinning occurred preferably at an intermediate grain size (Nb (ref. 38)) or where twinning stress increases with increasing grain size (Cr-35Re (ref. 40))). Thus, the occurrence of twinning for the present samples with a large grain size of >100 µm is more likely than for fine-grained samples. According to ref. 45, the twinning in Cr is more sensitive to grain size as compared with slip, such that the onset stress of slip easily surpasses the twinning stress at large grain sizes. Thus, initiation of plastic deformation might be achieved by twinning as opposed to slip. If we associate the first stress drops here with the twinning stress being reached36,37,38, it is approximately equal for both alloys and between 350 and 500 MPa for all temperatures. However, local stress concentration, for example, at grain boundaries or twin tips, might still be sufficiently high to initiate local dislocation slip. Thus, twinning might be the predominant mechanism of early plastic deformation but is probably not the only one. Conversely, if the twinning stress is not too large as in the present case, local stress concentrations or work hardening can also lead to twinning in an alloy that predominantly deforms by slip.
(3) The temperature dependence of yield strength depicted in Fig. 2c resembles the dependencies on (1) solid solution strengthening and (2) grain size. In the coarse-grained Cr-36.1Mo-3Si H, the very large grain size favours twinning to be the predominant deformation mechanism at the onset of plastic deformation. As the onset stress of twinning is a process insensitive to temperature and strain rate46, the temperature dependence of yield strength up to 700 °C remains weak. By contrast, the AC alloys exhibit smaller grain sizes obstructing deformation twinning. Consequently, dislocation slip exhibits a higher proportion to plastic deformation with twinning still being active. Hence, the strong temperature dependence of yield strength typical of bcc metals and alloys22 dominated by thermal activation of dislocation kink pair formation is obtained (AC in Fig. 2c).
As twinning is considered a low-temperature deformation mechanism, the twinning propensity obtained at 900 °C (Fig. 4b) seems unusual at first glance. However, Weaver43 suspected twinning in Cr and Cr-1V at temperatures of 200–600 °C but did not report microstructural or crystallographic proof. Deformation twinning at elevated temperatures was verified for up to 600 °C in Nb-55V (ref. 20) and 1,000 °C in MoWRe (ref. 47). The alloys investigated here surpass the binary Nb–V solid solutions and show deformation twinning at higher homologous temperature compared with MoWRe.
(4) As deformation twins are high-angle grain boundaries, they impede dislocation motion. Deformation twinning thus might contribute to dynamic grain-boundary strengthening similar to the observations during twinning-induced plasticity48. This might rationalize the high work hardening shown in Fig. 2d, specifically in the fine-grained AC conditions. On the basis of the discussion above, the proportion of slip is larger for the fine-grained material compared with the coarse-grained H. Hence, the work-hardening capability by the dynamic refinement and impediment of slip is improved in a fine-grained condition.


