


Cell culture and treatments
Human embryonic lung MRC5 fibroblasts (ATCC) and IMR90 fibroblasts (ATCC) were cultured in Dulbecco’s modified Eagle’s medium (Sigma Aldrich, D5796) supplemented with 10% heat-inactivated fetal bovine serum (FBS), 100 U ml−1 penicillin, 100 μg ml−1 streptomycin and 2 mM l-glutamine. The cultures were maintained at 37 °C in an atmosphere of 5% CO2. MRC5 fibroblasts were grown under atmospheric oxygen conditions, and IMR90 fibroblasts were cultured under low-oxygen (3%) conditions. Cells were tested regularly for mycoplasma contamination.
For lentiviral transduction HEK293T cells (ATCC) were used, cultured in DMEM without antibiotic and supplemented with 10% heat-inactivated fetal bovine serum (FBS) and 2 mM l-glutamine.
Stress-induced senescence was triggered by exposing cells to 20 Gy of X-ray irradiation and collected between 10 and 12 days post-irradiation. Chemotherapy-induced senescence was performed by treated cells with 250 nM of doxorubicin (MedChemExpress, HY-15142) for 24 h and collected 12 days after treatment. Replicative senescence was performed through serially passaging until the cells reached their replicative limit. Senescence was verified through the presence of p16 and p21, lack of proliferation and the expression of SASP genes.
For chronic acetate treatment, MRC5 or Parkin IMR90 cells were treated with 20 mM of sodium acetate solution (Sigma, S7899) for 10 to 12 days, with media refreshing every 48–72 h.
For chronic citrate treatment, MRC5 were supplemented with 10 mM of sodium citrate (Sigma, W302600) for 10 to 12 days, with media refreshing every 48–72 h.
For SLC25A1 and MPC pharmacological inhibition, MRC5 fibroblasts were irradiated with 20 Gy X-ray irradiation and treated with CTPI2 (Selleckchem, S2968) or UK5099 (Sigma, PZ0160) at the indicated concentrations (15 or 30 μM for CTPI2 and 100 μM for UK5099). CTPI2 and UK5099 were added one day after irradiation and maintained in the cell culture medium for 12 days (refreshed every 48–72 h). The same protocol was used for STING pharmacological inhibition where cells were treated with SN011 (Cayman Chemical, NC2044999) at concentration of 10 μM. For acetyl-CoA measurements, proliferative MRC5 were treated or not with 20 mM of sodium acetate-1-C13 (Sigma, 279293) or sodium acetate C12 (Sigma, S7899) and collected after 3 h. The analysis was performed in 4 million cells per condition.
Parkin-mediated mitochondrial clearance
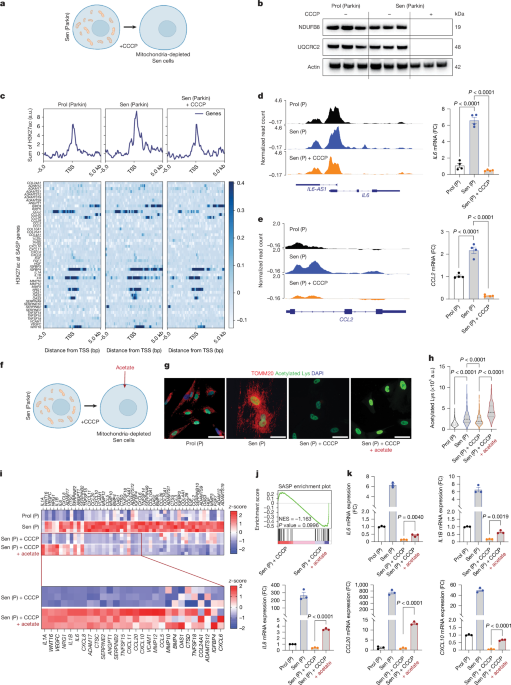
Parkin-mediated mitochondrial clearance was performed as previously described. In summary, proliferating or irradiated Parkin-overexpressing IMR90 fibroblasts were treated with 12.5 μM CCCP (Sigma Aldrich, C2759) one day post-irradiation (day 1) for a duration of 48 h, with CCCP being replenished every 24 h (day 1, day 2). Acetate was added at day 3 when mitochondria were cleared, and cells were collected at day 12 (media refreshed every 48–72 h).
Lactate dehydrogenase cytotoxicity assay
Cytotoxicity was assessed using a lactate dehydrogenase (LDH) assay (Abcam, ab65939) following the manufacturer’s instructions. Cells were seeded in 24-well plates, irradiated on day 0, and mitochondrial clearance was induced on days 1 and 2 (day 1 and day 2) using CCCP. At day 11 post-irradiation, the culture medium was refreshed. On day 12, 50 µl of the medium was collected and mixed with 50 µl of LDH reaction mixture. Absorbance was measured at 450 nm using a plate reader.
Subcellular fractionation and mtDNA extraction
Subcellular fragmentation and mtDNA extraction were performed following the previously described protocol3.
In summary, IMR90 were collected by trypsinization and washed once with PBS. Cells were then pelleted by centrifugation at 300g for 5 min at 4 °C. Cells were resuspended in mitochondrial isolation solution (MIS) (20 mM HEPES-KOH pH 7, 220 mM mannitol, 70 mM sucrose, 1 mM EDTA, 0.5 mM PMSF, 2 mM DTT) and transferred into a glass homogenizer on ice. Cells were broken open by strokes and efficiency was assessed under microscope with trypan blue staining. Cells were stroked until the homogenization was sufficient. The homogenate was then centrifuged twice at 800g for 5 min at 4 °C to remove all the cell debris and membranes. The supernatant was centrifuged at 16,100g for 10 min at 4 °C. The supernatant, which is the cytosolic fraction, was discarded and the pellet, which is the mitochondrial fraction, was washed once with MIS and centrifuged again at 16,100g for 10 min at 4 °C and the pellet was resuspended in 200 μl PBS.
DNA extraction was performed in the mitochondrial fraction using the DNeasy Blood & Tissue Kit (Qiagen, 69504) according to the manufacturer’s instructions.
mtDNA transfection and acetate supplementation following Parkin-mediated mitochondrial clearance
Mitochondrial clearance was performed in Parkin-mediated cells one day after irradiation as previously described3. Cells were treated or not with 20 mM of sodium acetate solution (Sigma, S7899) every other day. On day 10 post-irradiation, cells were transfected with mtDNA with a concentration of 10 μg of mtDNA for 500,000 cells using DharmaFECT kb DNA transfection reagent (Horizon, T-2006-01), according to the manufacturer’s instructions.
Measurement of mtDNA in the cytosolic fraction
Cytosolic fractionation was performed on 5 × 10⁵ cells per condition, and mtDNA levels were quantified using the Absolute Human Mitochondrial DNA Copy Number Quantification qPCR Assay Kit (ScienCell, 8948) according to the manufacturer’s instructions.
CRISPR–Cas9-based genome editing
The following plasmids were used:
hSLC25a1 CRISPR (sgRNA #231; Vector-Builder, VB900058-0699rvd), hMPC1 CRISPR (5′-CACCGGGGCTACTTCATTTGTTGCG-3′ AND 5′-AAACCGCAACAAATGAAGTAGCCCC-3′), hBAK CRISPR (Addgene, 129579), hBAX CRISPR (Addgene, 129580), Puro CRISPR (Addgene, 52961) (Plenti control).
For lentiviral transduction, HEK293FT cells were transfected with the plasmids above together with the packaging and envelope plasmids VSVG and Gag-Pol (Sigma Aldrich) using Lipofectamine 3000 (Invitrogen, L3000015) according to the manufacturer’s instructions. Then, 2 days later, the supernatant from the transfected HEK293FT cells containing viral particles was filtered using a 0.45-μm pore PVDF filter, mixed with 10 μg ml−1 of polybrene and used to infect the cells of interest. After infection, cells were selected for successful CRISPR–Cas9 deletion using the following antibiotics: 1 μg ml−1 of puromycin.
siRNA transfection
siACLY (Sigma, SASI_Hs01_00239323) and a scrambled control siRNA (Sigma, SIC001) were used. Cells were transfected with siRNA at a final concentration of 30 nM using DharmaFECT 2 transfection reagent (Horizon, T-2002-03) at a ratio of 0.3 μl per 100 μl transfection medium, according to the manufacturer’s instructions.
Irradiation-induced senescence
Cells were first transfected in T75 flasks for 24 h, then exposed to 20 Gy X-ray irradiation the following day. Cells were reseeded into 6-well plates 1 day post-irradiation (day 1) and transfected a second time at day 8 post-irradiation for 24 h. Cells were collected at day 10 post-irradiation for analysis.
Replicative senescence
Replicatively senescent cells were transfected twice, at day 1 and day 4, each for 24 h using the same conditions, and collected at day 6 for analysis.
13C-glucose tracing of H3K9ac
MRC5 cells (3 × 10⁶) were exposed to 20 Gy X-ray irradiation and maintained under standard culture conditions for 11 days. Cells were then incubated for 24 h in either standard DMEM (Gibco, 11965-092) containing unlabelled glucose (4.5 g per 500 ml) or glucose-free DMEM (Gibco, 11966-025) supplemented with 13C-d-glucose (4.5 g per 500 ml; Cambridge Isotope Laboratories, CLM-1396-5). Both media were supplemented with 10% heat-inactivated fetal bovine serum, 100 U ml−1 penicillin, 100 μg ml−1 streptomycin and 2 mM l-glutamine.
After 24 h, cells were collected and histones were acid-extracted with 0.4 M HCl for peptide analysis. Histones were digested with sequencing-grade trypsin (Promega, V5113) at a 1:20 enzyme-to-substrate ratio in ammonium bicarbonate (Sigma Aldrich, A6141) at 37 °C for 6 h. Digestion was quenched by acidification to pH 4 with acetic acid and neutralized with ammonium hydroxide (Sigma Aldrich, 338818). Samples were concentrated to 100 μl under nitrogen gas and desalted using C18 ZipTip pipette tips (MilliporeSigma).
Peptides were analysed by liquid chromatography–mass spectrometry (LC–MS) using standard procedures. Peak apex intensities for H3K9ac peptides were obtained from extracted ion chromatograms at mass to charge ratio (m/z) 637 and 654. An internal acetyl-CoA standard was used for quantification. 13C enrichment was calculated using IsoPat2 (ref. 30), with unlabelled samples serving as natural-abundance controls.
Cytosolic and mitochondrial fractionation for mass spectrometry
For subcellular fractionation, 4 × 10⁶ cells per sample were collected, washed with PBS and pelleted by centrifugation at 1,300 rpm for 5 min at 4 °C. Fractionation was performed as previously described31. Cell pellets were resuspended in KPBS buffer and homogenized using a Dounce homogenizer. Homogenization efficiency was assessed microscopically using trypan blue staining.
Homogenates were centrifuged at 1,000g for 10 min at 4 °C to remove nuclei and unlysed cells. The resulting supernatant was centrifuged at 17,000g for 10 min at 4 °C to separate mitochondria from the cytosolic fraction. The supernatant was collected as the cytosolic fraction. The pellet (mitochondrial fraction) was washed once with KPBS buffer and centrifuged again at 17,000g for 10 min. Aliquots of each fraction were reserved for western blot analysis to assess fraction purity prior to mass spectrometry.
LC–MS analysis of acetyl-CoA in cells, mitochondria and cytosolic fractions
Mitochondria or cell pellets were resuspended in 200 μl of 2.5% 5-sulfosalicylic acid (SSA) spiked with 50 ng of acetyl-CoA-d3 standard (Cayman: 40458) per sample and vortexed for lysis. Fifty microlitres of cytosolic fraction was mixed with 200 μl of 2.5% SSA containing 50 ng of acetyl-CoA-d3 and vortexed. All the samples were centrifuged at 17,000g at 4 °C for 5 min, and the supernatants were transferred into glass auto-sampler vials. The samples were analysed with a 1260 Infinity II HPLC coupled to an Agilent 6150 single quadrupole LC–MS. Ten microlitres of each sample was injected onto an Agilent InfinityLab Poroshell 120 EC-C18 column (699675-742). Temperatures for the auto-sampler set at 4 °C and the column compartment at 40 °C, respectively. The mobile phase was composed of solvent A (50 mM formic acid in LC–MS-grade H2O, adjusted to pH 8.2 with ammonium hydroxide) and solvent B (100% LC–MS grade methanol). The chromatographic gradient was run at a flow rate of 0.3 ml min−1 as follows: 0–1 min: hold at 20% B; 1–11 min: linear gradient from 20% to 100% B; 11–12 min: hold at 100% B; 12–13 min: linear gradient from 100% to 0% B; 13–20 min: hold at 100% B. The mass spectrometer was operated in selected ion monitoring (SIM), positive ion mode with the capillary voltage set to 3.5 kV, the nozzle voltage set to 2 Kv. The sheath gas was held at 250 °C at the flow rate 10 l min−1 and the drying gas was held at 300 °C at the flow rate 5 l min−1. The nebulizer pressure was set to 20 psig. The retention time and position of the peaks were confirmed using pure appropriate standard compounds freshly prepared in LC–MS grade water. The peak area/height was quantified using Agilent ChemStation. m/z of the following ions were detected: acetyl-CoA (m/z 810.6–811.6) and acetyl-CoA-d3 (m/z 813.6). IsoPat2 software was used to adjust for natural abundance30.
Citrate quantification by GC–MS for mitochondria and cytosolic fraction
Mitochondria pellets were resuspended in 500 μl 80% methanol spiked with 100 ng of 13C6 citrate standard and vortexed for lysis. Fifty microlitres of cytosolic fraction was mixed with 200 μl of 100% methanol containing 100 ng of 13C6 citrate and vortexed. All the samples were centrifuged at 17,000g at 4 °C for 5 min, and the supernatants were dried with nitrogen gas, dissolved in 75 μl dimethylformamide (DMF), then derivatized with 75 μl N-methyl-N-(tert-butyldimethylsilyl)trifluoroacetamide (MTBSTFA) + 1% tertbutyldimetheylchlorosilane (TBDMCS) (Regis). Samples were incubated at room temperature for 30 min and were analysed using an Agilent 7890B GC coupled to a 5977 A mass detector. Three microlitres of derivatized sample were injected into an Agilent HP-5ms Ultra Inert column, and the GC oven temperature increased at 15 °C min−1 up to 215 °C, followed by 5 °C min−1 up to 260 °C, and finally at 25 °C min−1 up to 325 °C. The mass spectrometer was operated in split-less mode with electron impact mode at 70 eV. Mass range of 50–700 was analysed, recorded at 1,562 mass units per second. Data were analysed by Agilent MassHunter Workstation Analysis and Agilent MSD ChemStation Data Analysis software to measure peak area/height of citrate for quantification. Citrate was detected by gas chromatography–mass spectrometry (GC–MS) as TBDMS derivatives at the following m/z values: citrate (m/z 591) and 13C6 citrate (m/z 597).
TCA metabolites quantification
TCA cycle metabolites were quantified by GC–MS. Briefly, cell pellets were lysed in 50 μl PBS after addition of 20 μl internal standard solution containing uniformly 13C-labelled metabolites. Proteins were precipitated by adding 300 μl chilled methanol-acetonitrile, and samples were centrifuged to collect the supernatant. The supernatant was dried under vacuum and derivatized sequentially with ethoxime and MTBSTFA + 1% TBDMCS. Samples were analysed on an Agilent 5977B GC–MS (Agilent Technologies, Santa Clara, CA) under electron impact ionization in single-ion monitoring mode.
Metabolite concentrations were determined using 12-point calibration curves processed in parallel. The following ions (m/z) were monitored: lactate (261.2), fumarate (287.1), succinate (289.1), α-ketoglutarate (360.2), malate (419.3), aspartate (418.2), 2-hydroxyglutarate (433.2), cis-aconitate (459.3), citrate (591.4), isocitrate (591.4) and glutamate (432.4).
Metabolomics by mass spectrometry
Metabolomic analyses following UK5099 treatment were performed. Cells were seeded in 6-well plates (5 × 10⁵−1.5 × 10⁶ cells per ml; triplicate wells per condition) in complete DMEM and allowed to adhere overnight for proliferating controls, or cultured and treated as previously described for Sen (IR) and Sen (IR) + UK5099 conditions. Cells were washed with PBS and incubated in the appropriate experimental medium for the indicated times.
Duplicate wells were used for cell counting, and counts were used to normalize extraction volumes (equivalent to 2 × 10⁶ cells per ml). Cells were rapidly washed with PBS, and ice-cold extraction solvent (methanol 50%, acetonitrile 30%, water 20%) was added before scraping on ice. Lysates were transferred to 1.5-ml tubes, vortexed, and centrifuged at 15,000 r.p.m. for 10 min at 4 °C. Supernatants were collected and stored at −80 °C until LC–MS analysis.
Chromatographic separation was performed using an isocratic program (80% solvent A, 20% solvent B) at a flow rate of 200 μl min−1 with a total run time of 3 min and an injection volume of 20 μl. Mass spectrometry was conducted on an Exactive instrument (Thermo Fisher Scientific) operating in positive ion mode, full-scan acquisition (m/z 50–800) at a resolution of 50,000.
ChIP–seq
Chromatin immunoprecipitation was performed as described32. Cells were formalin-fixed for 10 min in 4% paraformaldehyde (PFA), then lysed and chromatin was sheared to between 250–500 bp as confirmed by agarose gel electrophoresis in size using sonication (Biorupter pico, B01060010). Protein G Dynabeads (Invitrogen, 1000D) were prepared with 5 μg of primary antibody of interest: histone H3 (Abcam ab1791), histone H3K27ac (Abcam, ab4729). 1.7 μg chromatin as quantitated by qubit dsDNA HS Kit (Invitrogen Q32854) were used per chromatin immunoprecipitation and immunoprecipitation was performed overnight 4 °C with inversion. After washing steps, DNA was eluted using phenol chloroform isoamyl alcohol (Thermo Scientific J62336) isolation and ethanol precipitation then quantitated using qubit dsDNA HS Kit (Invitrogen Q32854) and submitted to Sanford Burnham Prebys genomic core for library preparation and sequencing on Element Biosciences AVITI sequencer.
ChIP–seq was performed as following described: Library preparation of ChIP DNA was performed with the Watchmaker DNA Library Prep Kit (Watchmaker Genomics, 7K0103) with xGEN Stubby adaptors (IDT, 10005924) and xGEN 10nt UDI Primers (IDT, 10008052). Libraries were sequenced (2× 76 bp) with the Element Biosciences AVITI Sequencing platform using the AVITI 2× 75 High Output Cloudbreak Freestyle Kit (Element Biosciences, 860-00015).
Generation of ChIP–seq analysis files
For ChIP–seq in Parkin cells and Sen (IR) cells treated by DMSO or CTPI2: H3K27ac and H3 ChIP–seq datasets were processed using the nf-core/chipseq Nextflow pipeline (v2.0.0) with Singularity containers and the parameters –aligner bowtie2, –read_length 75, and –genome GRCh38. H3K27ac bigWig signal tracks were normalized to H3 signal using deepTools (v3.5.5)33 bigwigCompare with the parameters –operation subtract and –binSize 10.
H2K27ac and H3 ChIP–seq samples were processed with nf-core chipseq nextflow pipeline version 2.0.0 (ref. 34) using singularity containers and parameters “–aligner bowtie2 –read_length 75 –genome GRCh38”. H3K27ac bigwig signal files were normalized by H3 signal using Deeptools bigwigCompare version 3.5.5 (ref. 33) with parameters “—operation subtract –binSize 10”.
For the Sen (IR) BAX/BAK1 CRISPR and Sen (IR) CRISPR empty vector experiment: Paired-end H3K27ac and H3 samples were trimmed using Cutadapt v5.2 with parameters “-m 25 -q 30,30 –nextseq-trim=30 -a AGATCGGAAGAGCACACGTCTGAACTCCAGTCAC -A AGATCGGAAGAGCGTCGTGTAGGGAAAGAGTGT”. Trimmed reads were processed using nf-core chipseq34 nextflow pipeline version 2.0.0 with apptainer containers and parameters “-profile singularity –aligner bowtie2 –read_length 150 –genome GRCh38 –macs_fdr 0.01 –skip_trimming true”. The nf-core chipseq pipeline performed alignment, alignment filtering, and peak-calling. Normalized signal files for H3K27ac samples were generated in bigwig format using bamCoverage from deepTools v3.4.3 (ref. 35) with parameters “–binSize 5 –normalizeUsing RPGC –extendReads –ignoreForNormalization chrX –effectiveGenomeSize 2913022398 –scaleFactor {sample-specific-scale-factor}”. Sample-specific scale factors were calculated for each sample by dividing number of reads within peaks (obtained from nf-core pipeline featureCounts summary table) by number of de-duplicated reads (fraction of reads in peaks, also called FriP). Scale factors were computed relative to sample with highest FRiP. Normalized signal files for H3 samples were generated using bamCoverage with parameters “–binSize 5 –normalizeUsing RPGC –extendReads –ignoreForNormalization chrX –effectiveGenomeSize 2913022398 –scaleFactor 1.0”. H3K27ac bigwig signal files were normalized by H3 signal using deepTools bigwigCompare with parameters “–operation subtract –binSize 5”. H3K27ac bigwig signal average files for biological replicates were generated using deepTools bigwigCompare with parameters “–operation mean –binSize 5”.
ChIP–seq databases analysis, track visualization and Heat map generation
Previously published ChIP–seq datasets (GSE106146, GSE56307, GSE74238 and GSE103590), together with newly generated data from this study (GSE279410), were analysed. ChIP–seq experiments performed in this work represent the average signal from three biological replicates per condition.
Genome browser tracks for selected loci were visualized using Integrative Genomics Viewer (IGV). Metaplots and heat map were generated using deepTools (computeMatrix and plotHeatmap) within the Galaxy platform.
Mitochondrial superoxide measurements
Cells were cultured in black 96-well plates suitable for fluorescence measurements. Experiments were performed 12 days post-irradiation (day 12). Proliferating cells were seeded into assay plates one day prior to measurement to ensure optimal adherence and recovery. Mitochondrial superoxide levels were assessed using MitoSOX Red Mitochondrial Superoxide Indicator (Thermo Fisher Scientific, M36008). Cells were incubated with 5 µM MitoSOX in serum-free medium for 10 min at 37 °C, protected from light. Following staining, cells were washed twice with phosphate-buffered saline (PBS) to remove excess dye. Fluorescence was then measured in PBS at 37 °C every 2 min for 50 min using a Varioskan LUX multimode microplate reader (Thermo Fisher Scientific).
Seahorse analysis
Cellular oxygen consumption rate (OCR) and extracellular acidification rate (ECAR) were measured using an XFe96 Extracellular Flux Analyzer (Agilent Technologies) with the Seahorse XF Cell Mito Stress Test Kit (Agilent, 103015-100), following the manufacturer’s instructions. Cells were seeded at 5,000 cells per well in Seahorse XF96 cell culture microplates and irradiated the following day. Measurements were performed 12 days post-irradiation (day 12). For proliferating control conditions, cells were seeded one day prior to the assay.
On the day of the assay, culture medium was replaced with Seahorse XF DMEM assay medium supplemented with 1 mM sodium pyruvate, 2 mM l-glutamine, and 10 mM glucose. Where indicated, CTPI2 inhibitors were maintained at the specified concentrations throughout the assay. Plates were incubated at 37 °C in a non-CO2 incubator for equilibration prior to measurement.
Mitochondrial function was assessed by sequential injection of the following compounds: oligomycin (1.5 µM), FCCP (1 µM), and a mixture of rotenone and antimycin A (0.5 µM each). OCR and ECAR were recorded according to the standard Mito Stress Test protocol.
Multiplex immunoassay for cytokine quantification in conditioned media
Conditioned media were generated by culturing 80,000 cells per condition in serum-free medium for 24 h. Media were collected and centrifuged at 2,000 rpm for 5 min at 4 °C to remove cellular debris. The clarified supernatant was aliquoted and stored at −80 °C until analysis. On the day of the assay, aliquots were thawed on ice and processed immediately.
Cytokine concentrations were quantified using Luminex xMAP multiplex technology with commercially available antibody panels (Bio-Techne; FCSTM18B, LXSAHM), following the manufacturer’s instructions. Samples were diluted 1:2 in the kit-provided diluent. Minimum fluorescence intensity (MFI) was acquired using a Luminex IntelliFlex system (Luminex).
Standard curves for each analyte were generated using a five-parameter logistic (5-PL) regression model, and cytokine concentrations were calculated with Quantist software (Bio-Techne). Final cytokine levels were expressed in pg ml−1.
Western blotting
Cells were lysed in lysis buffer (RIPA: 150 mM NaCl, 1% NP40, 0.5% sodium deoxycholate, 0.1% SDS, 50 mM Tris pH 7.4, 1× phosphatase and protease inhibitors cocktail in H2O) and the protein concentration was determined using the Bio-Rad protein assay (Bio-Rad, reagent A, 500-0113; reagent B, 500-0114; reagent C, 500-0115). Proteins were deposed by equal amount on each well and separated by molecular weight on NuPAGE 4 to 12% Bis-Tris gels (Invitrogen, NP0323). Proteins were secondary blotted on PVDF membrane using Power Blotter XL machine (Invitrogen, PB0010) and Power Blotter Select Transfer Stacks, PVDF, regular size (Invitrogen, PB5310). Membranes were blocked with TBS-Tween (TBS-T) blocking buffer (5% milk powder, 0.05% Tween-20 in TBS) and incubated with primary antibodies at 4 °C overnight (a list of the antibodies Supplementary Table 3). After washes in TBS-T, the membranes were incubated with a peroxidase-conjugated secondary antibody for at least 1 h at room temperature. The membranes were then incubated with either SuperSignal West Pico PLUS Chemiluminescent Substrate (Thermo Scientific, 34577) or the KwikQuant Western blot detection kit (Kindle Bioscience, R1100) according to manufacturer’s instructions, and visualized using iBright 1500 system from Invitrogen.
RT–qPCR
Total RNA was extracted using QIAshredder column (Qiagen, 79656) following by RNeasy Mini Kit (Qiagen, 74106). mRNAs were quantified by spectrophotometry (NanoDrop One, Thermo Fisher Scientific). cDNAs were synthesized with the MultiScribe reverse transcriptase (High-Capacity cDNA Reverse Transcription Kit, Applied Biosystem). PCR was performed for 40 cycles with TaqMan Probes (IDT) in Perfecta qPCR Tough mix (Quantabio95112.012) and run on CFX Opus 384 Real Time PCR Detection System (Bio-Rad). Different Probes used are listed in Supplementary Table 2. TBP for human cells and HPRT for mice sample were used as a reference gene for normalization and relative gene expression, compared to the control group, was calculated using the comparative cycle threshold (CT) method (2−∆∆CT).
RNA sequencing
RNA-seq was performed by Azenta Life Sciences using an Illumina platform with a paired-end configuration (2× 150 bp), generating approximately 30 million read pairs per sample. Raw sequencing reads were processed to remove adapter sequences and low-quality bases using Trimmomatic (v0.36). Quality-filtered reads were aligned to the Homo sapiens reference genome (GRCh38, Ensembl) using the STAR aligner (v2.5.2b), a splice-aware aligner capable of detecting exon–exon junctions to improve mapping accuracy. Alignment outputs were generated in BAM format.
Gene-level read counts were obtained using featureCounts from the Subread package (v1.5.2), summarizing reads overlapping annotated exon regions based on gene identifiers in the reference annotation file. Only uniquely mapped reads were included. For strand-specific libraries, reads were counted in a strand-aware manner as appropriate.
Differential gene expression analysis was performed in R using DESeq2. Comparisons were made between Sen (IR) and Sen (IR) + CTPI2 conditions. The Wald test was used to estimate statistical significance and log2 fold changes. Genes with a nominal P value < 0.05 and an absolute log2 fold change > 0.5 were considered differentially expressed.
For visualization, transcripts per million (TPM) values were used to generate z-score–normalized expression matrices for heat map representation across samples.
Immunocytochemistry
Cells were cultured on coverslip and fixed for 10 min using either 4% PFA in PBS for usual staining or 4% PFA with 0.2% of glutaraldehyde for mitochondrial network staining. After 3 PBS washes, cells were blocked and permeabilized for at least 1 h at room temperature with blocking buffer (PBS 0.3% Tritonx100, 5% BSA and 1:60 normal goat serum). Cells were incubated with primary antibodies overnight at 4 °C in humid chamber. After PBS washes, cells were incubated with secondary antibodies for at least 1 h at room temperature. After final washes, coverslips were mounted onto glass microscope slides with ProLong Gold Antifade Mountant with DAPI (Invitrogen). A list of the antibodies used is provided in Supplementary Table 3.
Pictures were taken with Leica widefield microscope DMi8 either at ×20 or ×63 magnification. Images were quantified using ImageJ software (v1.54p).
Formalin-fixed, paraffin-embedded tissue sections (3 µm) were deparaffinized in xylene (2 times for 5 min each) and hydrated using sequentially 5 min batch of 100% ethanol (twice), 90% ethanol, 70% ethanol and distilled water (twice). Antigen retrieval was performed by heating the sections to 98 °C in citrate buffer at pH 6.0 for 15 min. The slides were allowed to cool down for 30 min and were then rinsed in PBS twice for 5 min. To avoid nonspecific binding, tissue sections were blocked for at least 30 min at room temperature in the blocking solution (PBS, 0.1% BSA with 1:60 of normal goat serum). For membrane staining, WGA was applied for 30 min at room temperature and wash 3 times with PBS. Primary antibodies were incubating in blocking solution overnight at 4 °C in humid chamber. After several PBS washes, tissue sections were incubated with secondary antibodies for at least 1 h at room temperature. Finally, sections were mounted with ProLong Gold Antifade Mountant with DAPI (Invitrogen). A list of the antibodies used is provided in Supplementary Table 3.
Pictures were taken with Leica widefield microscope DMi8 either at ×20 or ×40 magnification. Images were quantified using ImageJ software (v1.54p).
Mouse models and treatments
All animal experiments were performed according to protocols approved by the Institutional Animal Care and Use Committee (IACUC) at Mayo Clinic. Male and female aged wild-type C57BL/6 mice (aged 19 months) were acquired from the National Institute on Aging (NIA) and were maintained in a pathogen-free facility under a 12 h:12 h light:dark cycle at 23–24 °C with free access to regular chow and water. The mice were housed in same-sex cages in groups of 5. The animals were randomly assigned into the vehicle or treatment group. Mice were gavaged with 50 mg kg−1 of CTPI2 (MedChem Express, HY-123986) diluted in corn oil 3 times a week for 3 months (from 19 months to 22 months old), at which point the animals were euthanized and tissues were collected for analysis. Frailty assessment, tightrope test and hanging test was conducted before and after the 3 months treatments. Grip strength was asset before, at mid-point (1.5 months) and after 3 months of treatment. The mice were euthanized and considered to be dead if they met humane end points.
For the validation of the p16 antibody in mice, p16 luciferase reporter mice (p16Luc/Luc) Alb.C57Bl6 mice and littermate control p16+/+ mice were used36. Mice were intraperitoneally injected with a single dose doxorubicin at 10 mg kg−1 or vehicle (NaCl), and tissues were collected at day 45 post-injection.
Stromal cells isolation
Hearts and kidneys were collected from mice after intraventricular perfusion of 10 ml PBS, minced with scalpels and digested with Liberase TM (Roche) diluted in RPMI1640 (GIBCO) as described previously24. Briefly, digestion of tissue fragments was performed by two successive incubations for 10 min with enzymatic solution at 37 °C under shaking and stopped by the addition of heat-inactivated fetal bovine serum (Gibco). Single-cell suspensions were obtained by filtrations on 100 µm and 40 µm cell strainers (BD Falcon). Cells were either pelleted and lysed for RNA extraction or seeded for in vitro experiment.
Frailty measurements
Frailty was assessed based on a 31-items performance-based frailty index that reflects on clinical signs of deterioration in mice, as described22. These clinical assessments include evaluation of integument, the musculoskeletal system, the vestibulocochlear/ auditory systems, the ocular and nasal systems, the digestive system, the urogenital system, the respiratory system, signs of discomfort, body weight, and body surface temperature. The severity of each parameter was rated as follows: a score of 0 was given for mice displaying no sign of frailty, 0.5 was given for mild deficits, and a score of 1 was given if severe deficits were observed.
Neuromuscular coordination analysis
Neuromuscular coordination and balance were assessed using the tightrope test. Mice were placed on a horizontal bar (1.5 cm diameter) elevated 60 cm above the floor. The latency to fall was recorded, with a maximum cut-off time of 60 s per trial. A trial was considered successful if the mouse remained on the bar for the full 60 s without falling. Each mouse underwent up to five trials separated by 30 s rest intervals. Testing was terminated once the mouse either completed five trials or achieved a cumulative time of 60 s on the bar.
Forelimb grip strength analysis
Forelimb grip strength was assessed by allowing mice to grasp a suspended wire coat hanger measuring 2 mm in diameter and 30 cm in length. The time each mouse was able to hang from the wire using its forelimbs was recorded. Each mouse was given 10 attempts, with 20 s of rest between attempts, to reach a cumulative hanging time of 90 s. Successful performance was defined as achieving a total of 90 s of hanging time, while a trial was considered a failure if the mouse fell from the wire.
Skeletal imaging
All bone imaging and analysis was performed in a blinded manner. Quantitative analysis of the lumbar spine (L4–L6) and distal femoral metaphysis were performed using the Viva Scan 40 μCT scanner (Scanco Medical AG, Basserdorf, Switzerland) with the following parameters: 55 kVp, 145 mA, high resolution, 21.5 diameter, 10.5 μm voxel size, 300 ms integration time. Using two dimensional (2D) data from scanned slices, 3D analysis was used to calculate morphometric parameters at both the lumbar spine (200 slices) and distal femoral metaphysis (100 slices) defining trabecular bone mass and microarchitecture, including trabecular bone volume fraction (BV/TV; %), trabecular number (Tb.N; 1/mm), trabecular thickness (Tb.Th; mm), trabecular separation (Tb.Sp; mm [higher values are associated with weaker bone]), and the structure model index (SMI), which indicates whether trabeculae are stronger, plate-like (lower values) or weaker, rod-like (higher values). Cortical thickness (Ct.Th; mm) was assessed at the distal femoral metaphysis (50 slices). Micro-finite element analysis (μFEA) was performed at the femoral metaphysis to assess failure load (N (bone strength)) using the manufacture’s software (Scanco Medical; Finite Element-Software v1.13). All μCT parameters were derived using the manufacturer’s protocols.
Plasma cytokine array
Blood was collected via cheek bleeding into EDTA-coated tubes. Samples were centrifuged at 4,000g for 20 min at 4 °C and supernatant (plasma) was collected. Plasma cytokine and chemokines levels were quantified by Eve Technologie using the Mouse High Sensitivity 18-Plex Discovery Assay.
Intra peritoneal glucose tolerance test
Mice were fasted for 16 h, after which fasting glucose levels were measured from tail blood. They then received an intraperitoneal injection of d-glucose (Sigma, 68270) at 2 g kg−1, and blood glucose levels were recorded with a glucometer at 15, 30, 45, 60, 90 and 120 min following the injection.
Metabolic analyses using whole-body indirect calorimetry
A 16-chamber Comprehensive Animal Monitoring System (CLAMS, Columbus Instruments) was used to measure oxygen consumption (VO2) and carbon dioxide production (VCO2) of individual mice, as previously described37. The mice were maintained under a 12:12 h light:dark cycle in a temperature-controlled room (22–24 °C). Oxygen and carbon dioxide analysers were calibrated with certified primary standard calibration gas. Mice were placed individually into the CLAMS chambers and allowed to acclimate for 14–18 h followed by the start of the 48-h experimental period beginning at 6 AM. Measurements were conducted for 24 h of fed and 24 h of fasted conditions. The respiratory exchange ratio (RER) was calculated from VO2 and VCO2 values. Energy expenditure was calculated using the equation [(3.815 + (1.232 × RER)) × VO2]. Food intake was measured as part of the cage calorimetry experiments using an integrated balance accounting for spillage of food. Physical activity levels were measured by photocells.
VetScan
Blood was collected via cheek bleeding into lithium/heparin-coated tubes. Samples were centrifuged at 4,000g for 20 min at 4 °C and supernatant (plasma) was collected. One hundred microlitres of plasma was analysed using the Comprehensive Diagnostic Profile (Zoetis, 10023220) according to the manufacturer’s protocol and read on the VETSCAN VS2 Chemistry Analyzer.
Triglyceride assay in muscle
Triglyceride levels were measured in quadriceps muscle samples using a minimum of 10 mg of tissue per sample, according to the manufacturer’s instructions for the Triglyceride Assay Kit (Abcam, ab178780).
Multiome
Nuclei isolation
For the multiome experiment, quadriceps muscles were collected from 2 pooled groups of four 22-month-old C57Bl/6 mice, treated for 3 months with either vehicle or CTPI2 (50 mg kg−1). Approximately 25 mg of frozen tissue from each pooled sample was used for nuclei isolation. The nuclei isolation was performed at 4 °C using a Singulator 200 instrument (S2 Genomics) with a regular cartridge, according to the manufacturer’s instructions. The Single Shot Extended Nuclei Isolation program was used with a 10 min incubation time and the mixing type modified for trituration. Nuclei isolation was performed in the presence of 1 U μl−1 of RNase inhibitor (Roche). After incubation, the samples were passed through a 40 µm Flowmi cell strainer (Electron Microscopy Sciences), and the flow through was then centrifuged at 500g for 5 min at 4 °C. After centrifugation, the nuclei were resuspended in diluted nuclei buffer. The nuclei concentration was assessed by PI staining using a Cellometer K2 cell counter. Between 8,000 and 10,000 nuclei were targeted for capture and used for single-nucleus ATAC–seq (snATAC–seq) plus single-nucleus RNA-seq (snRNA-seq).
snATAC–seq and snRNA-seq
snATAC–seq plus snRNA-seq was performed using the 10x Genomics platform. Between 8,000 and 10,000 nuclei per sample were subjected to transposase assays before proceeding to single-cell partitioning into gel beads in emulsion, barcoding and pre-amplification according to the manufacturer’s instructions. ATAC library construction and cDNA, followed by GEX library construction, were also done following established 10x Genomics protocols. The libraries’ concentration was measured using Qubit High Sensitivity assays (Thermo Fisher Scientific), and library profiles were assessed in a fragment analyser (Agilent) before sequencing. The snATAC and snRNA libraries were sequenced for 50 bp and 100 bp paired-end sequencing, respectively, on a NovaSeq X 10B instrument (Illumina) before demultiplexing and alignment to the reference mouse genome.
Multiome analysis
The snATAC–seq + snRNA-seq data were processed using CellRanger-ARC (v2.0.2), Seurat (v5.3.1) and Signac (1.16.0). Sequenced reads from the GEX and ATAC droplet libraries were aligned and quantified using 10x Genomics Cell Ranger ARC v2.0.2. The reads were aligned to the pre-built mouse reference genome GRCm39-2024-A provided by 10X Genomics. GEX and ATAC count matrices from each sample were merged independently using Seurat. GEX count matrix was log-normalized, scaled to mean 0 and variance 1, and dimensionality reduction was performed using principal components analysis on the top 2,000 most highly variable genes. UMAP for GEX was calculated using the top 50 principal components. Open chromatin peaks called per sample were merged using reduce function from GenomicRanges (v1.56.2) R package, then the ATAC fragment count matrix was recalculated using Signac. Merged peaks that were smaller than 20 base pairs or larger than 10,000 base pairs were removed from analysis. The ATAC count matrix was normalized using term frequency − inverse document frequency (TF-IDF) and dimensionality reduction performed using singular value decomposition (SVD) using only peaks with non-zero counts in at least 20 cells – together known as latent semantic indexing (LSI) that generates LSI components. The UMAP for ATAC was calculated using LSI components 2 to 50. Seurat’s WNN algorithm was used on principal components 1 to 50 (GEX) and LSI components 2 to 50 (ATAC) together to obtain a combined UMAP projection of both modalities. Cells with more than 20% of reads mapped to mitochondrial genes, those with less than 200 unique genes detected (GEX), those with less than 200 unique peaks detected (ATAC) and those with TSS enrichment score (as calculated by Signac) less than 1 were removed for quality control. After QC filtering, the resulting data included 13,400 cells from 2 samples.
Cell-type identification was performed by unsupervised clustering using a shared nearest neighbour modularity optimization-based clustering algorithm performed by Seurat’s FindNeighbors and FindClusters functions followed by marker validation. Markers for each cluster were identified using Seurat’s FindAllMarkers function. Cell type identification followed commonly used markers for key cell types38,39.
Sen-like cells were identified by scoring each cell based on their expression of either CoreScence25 gene set or GenAge26 using AddModuleScore function. Cells in the top quartile of the CoreScence score distribution or on the top 20% of the GenAge score distribution were classified as Sen-like cells.
Gene activity scores (the chromatin accessibility associated with each gene) were calculated using Signac’s GeneActivity function. Differential analysis of gene expression (GEX) and gene activity (ATAC) was performed using FindMarkers function with parameters: min.pct = 0.
Multiplex immunohistochemistry
Paraffin-embedded sections were dewaxed, rehydrated, and subjected to antigen retrieval in citrate buffer (pH 6.0). Endogenous peroxidase was quenched using Dako Dual Endogenous Enzyme Block (Agilent, S2003) for 10 min. Sections were blocked in TSA buffer and photobleached with H2O2 under LED illumination for 5 min. Slides were incubated overnight at 4 °C with anti-p16 (ab211542, Abcam; 1:1,000), followed by SignalStain Boost HRP secondary (Cell Signaling Technology) for 15 min and Opal fluorophore (Akoya) for 15 min. After washing, antigen retrieval (citrate buffer, pH 6.0) was repeated. Sections were blocked and incubated for 1 h at room temperature with anti-p21 (ab188224, Abcam; 1:1,000), followed by HRP secondary and Opal fluorophore as above. Nuclei were counterstained with DAPI, and slides were imaged on a Leica DMi8 microscope.
Subsequent cycles without TSA amplification
Slides were washed, photobleached (H2O2, LED, 5 min), and blocked in PBS containing BSA and normal goat serum for 30 min. Sections were incubated for 1 h at room temperature with anti-PCNA (mouse, ab29, Abcam; 1:500) and anti-acetyl-lysine (rabbit, 9441S, Cell Signaling Technology; 1:200), followed by Alexa Fluor-conjugated secondary antibodies (goat anti-mouse 594, goat anti-rabbit 488; 1:1,000) for 1 h. After washing, nuclei were stained with DAPI and slides were imaged on a Leica DMi8 microscope. Multiplex images were analysed using SenoQuant, an automated image analysis pipeline for senescence marker quantification (GitHub: https://github.com/HaamsRee/senoquant).
Human data analysis
Bulk RNA-seq data for human tissues were obtained from the GTEx Portal (Analysis V11; gene-level TPM values)40. A mitochondrial-dependent SASP score was computed for each sample as the mean TPM expression of the 51 SASP genes included in this study. Correlation P values controlling for age were obtained using multiple linear regression performed in Prism software (v10.0).
Graphics
Schematic illustrations for experimental design and organ-specific diagrams were created with biorender.com for Figs. 1a,f, 2a, 3a, 4a, 5a,e,m, 6a and 7a,l. Extended Data Figs. 3a, 4a, 6g, 8k, 10g,k, 12m,q,s and 13a,e,i,m and Supplementary Fig. 1a,b.
Statistical analysis
GraphPad Prism v.10.0 was used for statistical analysis; the results were considered to be statistically significant when P ≤ 0.05; NS was used to indicate non-significant results. For normally distributed data, the differences between two groups were tested for statistical significance using an independent-sample two-tailed t-tests. For data that were normally distributed and when there was more than one group, one-way ANOVA was used, with Tukey’s comparison post hoc test. Where data were not normally distributed, Mann–Whitney U tests were used to determine statistical significance.
Ethics statement
All animal experiments were performed according to protocols approved by the Institutional Animal Care and Use Committee (IACUC) at Mayo Clinic.
Reporting summary
Further information on research design is available in the Nature Portfolio Reporting Summary linked to this article.

