


Ethical approval
The Disrupting Harm Survey was reviewed and approved by a global institutional review board (HML IRB Research and Ethics). Moreover, ethics approval was obtained from national or institutional ethics review bodies in each of the 12 participating countries. These included the National Commission for Science, Technology and Innovation (Kenya); Makerere University School of Public Health and the Uganda National Council of Science and Technology (Uganda); the Cambodia National Council for Children and the Ministry of Interior (Cambodia); the Ministry of Health, National Committee on Bioethics for Health (Mozambique); the Medical Research and Ethics Committee (Malaysia); the Health Research Ethics Committee, National Institute of Health Research and Development (Indonesia); the Ministry of Health and Social Services Ethical Review Board (Namibia); the Ministry of Labour, Invalids and Social Affairs (Vietnam); the Philippine Social Science Council Ethical Review Board (the Philippines); the Ethiopian Society of Sociologists, Social Workers and Anthropologists (Ethiopia); and multiple bodies in Tanzania: the National Institute of Medical Research, National Bureau of Statistics and the President’s Office–Regional Administration and Local Government, with permits from the Tanzania Commission for Science and Technology and additional approvals from the Zanzibar Health Research Institute. In Thailand, the study was reviewed by a special panel at Mahidol University’s Institute of Human Rights and Peace Studies, as no formal government ethics review process exists for social research.
Dataset and participants
Disrupting Harm child survey
This survey was conducted between 2020 and 2021 across 12 countries in Eastern and Southern Africa and Southeast Asia and was designed to be representative of each country’s digitally connected population. A random-probability clustered-sample design was used to ensure all households had an equal chance of being sampled, while accounting for some countrywide variation. Ipsos Mori collected the data using a combination of face-to-face household interviews and online interviews (possibly due to the COVID-19 pandemic restrictions) to ensure maximum national coverage of the total population that had the probability of being included in the survey. The total sample size was approximately 1,000 children and caregivers in each country (Cambodia, n = 992; Ethiopia, n = 1,000; Indonesia, n = 995; Kenya, n = 1,014; Malaysia, n = 995; Mozambique, n = 999; Namibia, n = 994; the Philippines, n = 950; Tanzania, n = 996; Thailand, n = 967; Uganda, n = 1,016; Vietnam, n = 994), including some of the regions with the highest rates of violence against children in the world13 (Supplementary Table 1 for data collection timelines). The sampling strategy was further implemented in three stages: (1) 100 primary sampling units (PSUs) with a probability proportional to population size, region and urbanity were selected; (2) random samples of household units within each PSU were undertaken; and (3) children (and caregivers) within each eligible household unit were identified by a local enumerator. Field coverage varied slightly between countries owing to inaccessibility because of conflict-affected or remote areas. Kenya, Namibia, Cambodia and Mozambique had 100% coverage, while Indonesia had the lowest national coverage at 76% given its dispersed geography (Supplementary Fig. 1). Once PSUs were identified, the selection of household units was done using random walk methods, which included a random starting point, usually a landmark area (for example, church, mosque, bridge). To be included, children needed to have used the internet at least once in the past 3 months. Gender matching between interviewer and interviewee was encouraged and informed consent was provided by children and their caregivers.
We analysed data from the 11,912 children aged 12–17 years (full sample, 23,824 including parents), including 6,044 (51%) boys and 5,868 (49%) girls, 3,112 (26%) 12–13-year-old children, 3,954 (33%) 14–15-year-old children and 4,846 (40%) 16–17-year-old children (survey-weighted; unweighted counts in Supplementary Table 39). Gender-specific estimates were calculated among internet-using adolescents from the Disrupting Harm child survey. We could not construct comparable gender-specific population denominators because harmonised data on internet use by age (12–17 years) and gender are not consistently available across all study countries, including from the International Telecommunication Union (ITU) statistics (Supplementary Fig. 12).
The inclusion of rural and peri-urban children in LMICs is a particular strength of this dataset. 6,586 (55%) of the children were living in rural areas, 1,177 (10%) were living in peri-urban areas and 4,149 (35%) were living in urban areas (see Supplementary Table 32 for the full-weighted sample demographics, Supplementary Table 38 for children who experienced one or more forms of technology-facilitated CSEA, and Supplementary Table 39 for survey-weighted prevalence by demographic subgroup with unweighted counts and 95% CIs). A detailed pre-analysis plan was time-stamped and archived on the Open Science Framework (OSF) before data analysis (15 April 2022; https://osf.io/3tpqa/files/osfstorage?view_only=5f02ad5dcbbe4d2ab2b161ce9a00ccfb).
Disrupting Harm household survey (internet exposure)
In each country, the Disrupting Harm household survey (2020–2021) visited a nationally representative sample of approximately 1,500–10,000 households depending on connectivity. At each household, enumerators established whether any children aged 12–17 years lived in the household and, if so, whether those children used the internet (through any device and at any location). These exposure data were collected regardless of whether a child from the household completed the separate CSEA interview, thereby avoiding selection on child interview participation. Aggregating responses across sampled households yielded the national proportion of 12–17-year-old children who are internet users for each country. For validation, we compared these estimates with ITU youth internet-use indicators (typically ages 15–24 years, nearest available year; Supplementary Fig. 13). As ITU data differ in age band and reference period, we retained the Disrupting Harm household data as our primary exposure source (Supplementary Fig. 11).
Measures
Overall instance of technology-facilitated CSEA
Measuring technology-facilitated CSEA
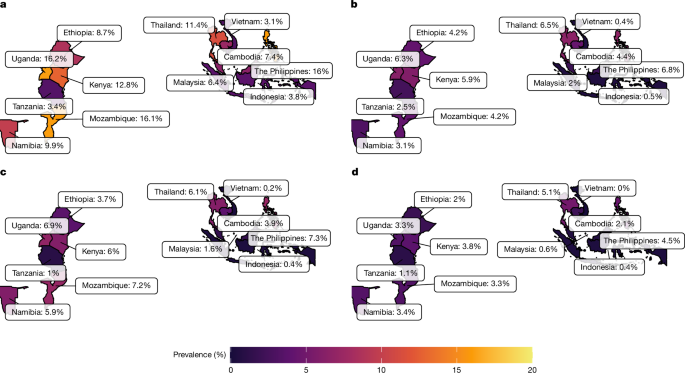
The prevalence of CSEA among internet-using children was measured using a composite variable capturing whether a child had experienced any form of technology facilitated CSEA within the past year, as reported during the 2020–2021 survey period (Supplementary Information 2.4 and Supplementary Tables 3 and 54). Rather than computing an average frequency, this variable provides a binary classification, flagging children who have been exposed to one or more types of sexual harms in the digital environment. The construction of this variable was implemented in two stages and combined responses to a battery of questions about (1) whether they had experienced one or more forms of CSEA; and (2) whether this occurred online (Supplementary Table 4).
First, to determine whether they had been exposed to technology-facilitated CSEA, children were asked nine screening items: “In the past year, how often have these things happened to you” (country-wise and Likert scale responses are shown in Supplementary Table 37). Their responses on a Likert scale were converted into binary indicators: a response of “never” was recoded as 0 (indicating did not experience), while responses ranging from ‘rarely’ to ‘very often’ were recoded as 1 (indicating did experience).
-
(1)
Someone made sexual comments about me (such as jokes, stories or comments about my body appearance or sexual activities) that made me feel uncomfortable.
-
(2)
Someone sent me sexual images I did not want.
-
(3)
I have been asked to talk about sex or sexual acts with someone when I did not want to.
-
(4)
I have been asked by someone to do something sexual when I did not want to.
-
(5)
I have been asked for a photo or video showing my private parts when I did not want to.
-
(6)
Someone offered me money or gifts in return for sexual images or videos.
-
(7)
Someone offered me money or gifts to meet them in person to do something sexual.
-
(8)
Someone shared sexual images of me without my consent.
-
(9)
Someone threatened or blackmailed me to engage in sexual activities.
Second, to estimate whether this happened online or offline, children were asked: “Thinking about the last time this happened, did it happen in any of these ways?”. The response items included multi-select options; that is, the children could select any of the following options: “in person”, “on social media” (for example, Facebook, YouTube, Snapchat, WhatsApp, Twitter)”, “in an online game”, “some other way”, “prefer not to say” or “don’t know” for each category of CSEA (Supplementary Tables 4, 47, 48 and 53). We coded a binary indicator as 1 if, for any of the nine harms, the child reported experiencing the harm and indicated that it occurred on social media or in an online game. This approach ensured that the final variable counted all those children who experienced sexual harms in the digital world.
Dual reporting approach
We report technology-facilitated CSEA prevalence in two ways. First, we estimate prevalence among internet-using children directly from the Disrupting Harm child survey. Second, we estimate prevalence in the total population aged 12–17 years by multiplying individual-level prevalence by internet penetration rates from the Disrupting Harm household survey. This approach assumes that only children with internet access can experience technology-facilitated sexual harms.
Uncertainty propagation
We propagated uncertainty from both survey components using Monte Carlo simulation to estimate 95% CIs for population-level prevalence and we drew 5,000 samples from each component’s sampling distribution on the logit scale, calculated the product for each iteration, and extracted the 2.5th and 97.5th percentiles of the resulting distribution (Supplementary Figs. 14 and 15). This approach treats the child and household surveys as statistically independent, justified by their separate sampling frames, child respondents and field operations. We calculated standard errors using effective sample sizes (Kish’s method; Supplementary Information 2.2) that account for survey weights. For the internet exposure component in countries where sample sizes were unavailable, we applied conservative default standard errors (3 percentage points for internet exposure and 5 percentage points for prevalence among internet users). These defaults affect only the width of the confidence intervals, not the point estimates.
Several considerations warrant caution when interpreting population-level estimates. First, internet exposure data were collected in 2020–2021. In rapidly digitalizing countries, exposure rates have probably increased substantially since then, meaning that our estimates do not represent current population burden. Second, the household measure captures regular internet use but may not capture occasional use outside the home (for example, at schools or community centres), leaving our prevalence estimates conservative. Third, our framework assumes children without internet access cannot experience technology-facilitated harms, an assumption that cannot be empirically validated with our data. Given these constraints and propagated uncertainty, population-level estimates should be interpreted as illustrative indicators of relative burden across countries rather than precise national estimates. A full list of caveats is provided in Supplementary Information 2.2.
Disclosure
To determine whether children disclosed online sexual incidents, they were asked “Who did you tell about what happened?” and presented with a list of multiple response options such as potential individuals, educators, and law enforcement organizations. They could also respond that they “hadn’t disclosed to anyone”, “didn’t know whether they had” or “preferred not to say” (multiple responses possible). As each disclosure target is a distinct behavioural decision with potentially different determinants and our exploratory research question is channel-specific, we derived three child-level binary indicators:
-
(1)
Any disclosure (told all): coded 1 if the child disclosed at least one CSEA type to any channel 0 otherwise.
-
(2)
Informal disclosure (told informal): coded 1 if the child disclosed any CSEA type to informal sources (parents/caregivers, siblings, friends, other adults, or other), 0 otherwise.
-
(3)
Formal disclosure (told formal): coded 1 if the child disclosed any CSEA type to formal authorities (teachers, police, helplines, social workers), 0 otherwise.
These categories are non-mutually exclusive (Supplementary Tables 40 and 41). Children who disclosed to both formal and informal channels are counted in both categories because each disclosure represents a distinct behavioural decision potentially influenced by different factors. Children selecting only “didn’t tell anyone” were counted as non-disclosures. Children could also select “prefer not to say,” or “don’t know”, which were counted as non-responses. As this question used this multi-select format, channel proportions can sum to more than 100% by design, as children who disclosed to multiple sources are counted in each applicable category. See Supplementary Fig. 25 for mutually exclusive categories of disclosure.
Barriers to disclosure
After the reporting item, adolescents who indicated “I did not tell anyone about it” for a given technology-facilitated CSEA harm received a multi-select barrier question (“Were any of the following reasons why you did not tell anyone about what happened?”). The unit of analysis is the non-disclosed incident at the CSEA-type level (that is, for each CSEA type where the child did not disclose).
For each barrier, we estimated the survey-weighted percentage of all non-disclosed incidents that cited that barrier. As the item is multi-select, an instance can contribute to multiple barrier categories, and percentages within a harm type need not sum to 100%. To assess whether barriers cluster, we constructed a co-occurrence matrix of weighted joint percentages among all non-disclosed incidents (Supplementary Fig. 26 and Supplementary Tables 55 and 56). Children could select any of the following multi-select barriers:
-
(1)
I did not know where to go or who to tell.
-
(2)
I felt embarrassed, ashamed or that it would be too emotionally difficult to tell.
-
(3)
I did not think anyone would believe me or understand my situation.
-
(4)
I was worried I would get in trouble if I told someone.
-
(5)
I felt that I did something wrong and did not want to tell.
-
(6)
I did not think it was serious enough to report.
-
(7)
I did not want the person who did this to get into trouble.
-
(8)
I feared it would cause trouble for me or my family.
-
(9)
I did not think anything would be done.
-
(10)
I did not know you could report these things.
-
(11)
My friends discouraged me from reporting.
-
(12)
My parents discouraged me from reporting.
-
(13)
I feared it would not be kept confidential.
Predictors of disclosure
Informed by the integrated child-centred model for violence prevention51, and Bronfenbrenner’s socioecological framework52, we situate disclosure within the broader context. These frameworks recognize that online violence intersects with a range of risk and protective factors, including individual, interpersonal, community, structural and institutional factors51,80. We preregistered a logistic regression with predictors across four conceptual levels: demographic (age and gender), family (enabling parental mediation of online activities), cultural (children’s attitudes towards sex) and protective factors (whether the child received sex education, had the knowledge of where to seek help, or had digital skills to report) (response options are shown in Supplementary Table 33, and country-wise responses are shown in Supplementary Tables 35 and 36).
Demographics
We included a continuous measure of age (centred at the mean for models) and binary measure for gender (treated as 1 = girl and 0 = boy in models). For regression models, gender was entered as a two-level factor with +0.5 contrast coding (boy = −0.5, girl = +0.5). We had no directional prediction regarding how individual factors such as age and gender may be related to disclosure. Previous research has found that girls are more frequently subjected to sexual abuse57, which might make them less likely to disclose given the increased prevalence. At the same time, boys may be less likely to report abuse owing to feelings of shame, potentially reducing their likelihood of disclosure40.
Family
To measure enabling parental mediation of online interactions, children answered the question “When you use the internet, how often does your parent/carer/guardian do any of these things?”, rating the frequency (from 1 = never to 5 = very often) of four specific behaviours that capture active support, help and supervision in navigating the online space. These behaviours included (1) encouraging the child to explore and learn things on the internet; (2) suggesting ways to use the internet safely; (3) helping the child when something bothers them on the internet; and (4) doing shared activities together on the internet. We took the item mean to obtain the enabling parental mediation measure (Cronbach’s Alpha across all parental mediation items was α = 0.78).
We hypothesized that enabling parental mediation would be associated with a higher likelihood of disclosure. Research indicates there are different tiers of parental mediation81, including restrictive, active, supportive and co-playing mediation strategies, that buffer children’s exposure to online risks59,81. However, digital parenting styles may differ cross-culturally and diverse research on parental strategies remains lacking82. Yet some empirical evidence from Pakistan suggests that parents who are engaged in highly active mediation of internet safety are likely to mitigate adverse experiences online58.
Culture
Attitudes towards sex were measured with responses to the following statements: (1) “Having sex before marriage is acceptable”; (2) “Only men, not women, should decide when to have sex”; (3) “If someone insults a boy or man, he should defend his reputation with force if he needs to”; (4) “A woman should tolerate violence to keep her family together” (recoded: 1 = yes, 0 = no). These were then bifurcated into two separate variables; the first statement measured attitudes towards premarital sex, a proxy for measuring positive gender norms, while the latter three statements were conceptually distinct and combined to measure inequitable gender attitudes. We analysed two predictors: premarital sex (item 1) as a separate binary variable (0.5 centred for regression) to account for the positive gender norm, and an inequitable gender-attitudes index equal to the sum of items (items 2 to 4) (range 0–3; higher = more inequitable).
We hypothesized that the combined gender norm measure (1–4 items) may be related to lower likelihood of disclosure. Decades of research on violence against women have shown that gender inequality is often linked to the acceptance of intimate partner violence and gender-based violence71,72,83,84. In some countries, patriarchal views normalize violence against women85, for example, a study using high-quality data from the Gender and Adolescence: Global Evidence86 in Ethiopia found that community norms, more than household attitudes, predicted violence against children71.
Protective level
We included three factors that could theoretically be related to the likelihood of disclosure: sex education, digital skills to report and the child’s knowledge of how to seek help. Sex education was measured by children answering if they had “received any sex education” (the term ‘sex education’ was changed to ‘reproductive health’ in Cambodia) (binary variable: 1 = yes, 0 = no). A child’s knowledge of how to seek help (help-seeking knowledge) was measured by children answering whether they knew where to get help if “you or a friend experience sexual assault or sexual harassment” (binary variable: 1 = yes, 0 = no). Digital skills to report was measured by children answering if they knew how to “report harmful content”, which was measured on a scale of 1 to 4 (1 = not at all true for me, 4 = very true for me). Note that the digital skills questions measured a total of eight skills and competencies related to internet use, including information, operational, social and creative skills. However, for this analysis, we selected only the core social skill related to disclosure.
We hypothesized that sex education, digital skills and a child’s knowledge of how to seek help when they or a friend are assaulted would be positively associated with disclosure. Previous research has identified specific protective factors, such as sex education and digital skills that are linked to children’s attitudes toward online safety21,62. Research has also underscored the importance of online safety resources in directly addressing the complexities of child abuse50,87.
Inclusion criteria
In the Disrupting Harm survey, we first adjusted the country’s sample size to reflect the weights, dropping 707 responses and then omitting observations that we had planned to exclude, such as non-responders (don’t know or prefer not to say) and variables with high missingness (Supplementary Table 35).
Analyses
Using Bayesian multilevel logistic regression models, we modelled our binary outcomes (1) whether a child experienced technology-facilitated CSEA (Supplementary Tables 5 and 6 and Supplementary Fig. 20); and (2) whether they disclosed the experience, where individual children formed the lower level and countries the upper level. First, we analysed whether age and gender predicted the likelihood of experiencing one or more types of technology-facilitated CSEA (1 = did experience, 0 = did not experience). We modelled this outcome as Bernoulli distributed with a logit link function:
$$\begin{array}{c}\mathrm{logit}(\Pr ({\mathrm{CSEA}}_{{ij}}=1))={\beta }_{0}+{u}_{0j}+({\beta }_{1}+{u}_{1j}){\mathrm{Gender}}_{{ij}}\\ \,+\,({\beta }_{2}+{u}_{2j}){\mathrm{Age}}_{{ij}}+({\beta }_{3}+{u}_{3j}){\mathrm{Gender}}_{{ij}}{\mathrm{Age}}_{{ij}}\end{array}$$
where β0, β1, β2, β3 represent the fixed effects for the intercept, gender, age and their interaction respectively, Genderij and Ageij represent the gender and age of child i in country j and u0j represents the random effect of belonging to country j, u1j, u2j and u3j represent the random slopes of gender, age and their interaction in the model. We modelled the country-specific parameters as multivariate normally distributed.
As logit-scale interaction coefficients can be hard to interpret88, we report predicted probabilities and AMEs for gender, age and their interaction. Uncertainty reflects posterior draws and is summarized with 95% credible intervals. AMEs are averaged over the observed country-level random effects, reflecting the average effect across the 12 study countries in the sample. To evaluate evidence for the null, we conducted Bayesian equivalence tests by calculating the proportion of the posterior distribution falling within a ROPE defined as odds ratios between 0.67 and 1.50, a range conventionally considered negligible89,90. We also compared additive and gender and age interaction specifications using Pareto-smoothed importance-sampling leave-one-out cross-validation (PSIS-LOO)91 (Supplementary Fig. 22). The difference in expected log predictive density (ΔELPD) was −0.9 (s.e.m. = 1.9), indicating no meaningful improvement in out-of-sample predictive performance from including the interaction.
We further examined whether prevalence of technology-facilitated CSEA differed across urban, peri-urban and rural settings, while accounting for gender, age and cross-country heterogeneity (Supplementary Tables 8 and 9). We report results as AMEs on the probability scale, population-averaged over country random effects. This model preserves an additive fixed effect for degree of urbanization (that is, the urban, peri-urban and rural contrasts are adjusted for gender and age), while allowing gender and age effects (and their interaction) to vary by country as random slopes. We chose not to model degree of urbanization with random effects because each country contributes only three categories, making random-effects estimation unstable and difficult to interpret.
We next modelled disclosure (1 = did disclose, 0 = did not disclose) using the same Bayesian multilevel logistic regression framework, with the following predictors: gender, age, attitudes towards premarital sex, inequitable gender attitudes, enabling parental mediation, digital skills to report, sex education and knowing where to seek help if you or a friend were sexually assaulted. We assessed multicollinearity using variance inflation factors on the complete-case sample; all variance inflation factors values were below 3 (Supplementary Table 14). Weighted Pearson correlations among all predictors were examined as a further check for multicollinearity (Supplementary Fig. 27). This model was specified as:
$$\mathrm{logit}(\Pr ({\mathrm{Disclosure}}_{{ij}}=1))={\beta }_{0}+{u}_{0j}+\mathop{\sum }\limits_{p=1}^{P}({\beta }_{p}+{u}_{{pj}}){X}_{{pij}}$$
where β0 is the fixed intercept, u0j is the random intercept for country j, P is the total number of predictors, βp is the fixed effect for predictor p, upj is the country-specific random slope for predictor p, and Xpij is the value of predictor p for child i in country j.
To reduce the risk of overfitting, we applied shrinkage through a horseshoe prior on the fixed effect coefficients to regularize estimation, specifying three degrees of freedom and a global scale parameter of 0.5. The horseshoe prior induces adaptive shrinkage and is a recommended Bayesian alternative to LASSO for variable selection92. All other parameters retained brms default priors: a Student-t(3, 0, 2.5) prior for the intercept, half-Student-t(3, 0, 2.5) priors for random effect standard deviations and an LKJ(1) prior for the random effects correlation matrix93,94.
To assess whether predictor–disclosure associations varied by country, we compared a baseline additive model (all predictors fixed, random intercepts for country) to a series of models in which one predictor at a time had a random slope by country (for example, inequitable gender attitudes allowed to vary by country) (Supplementary Tables 16–19 and Supplementary Fig. 28). We used PSIS-LOO to compute ELPD and ΔELPD (s.e.) relative to the baseline model91. ΔELPD values ranged from −3.1 to 0.0 (s.e.: 3.4-4.3), indicating no supported improvement from adding any single random slope (Supplementary Table 20 and Supplementary Fig. 29). Bayesian R2 for the complete-case model is reported in Supplementary Table 15. Posterior correlations among fixed-effect parameter estimates for all disclosure models are reported in Supplementary Figs. 30–32.
We used Bayesian methods for all model estimation because they are well suited to estimating (co)variance parameters in multilevel models93. We estimated all models using Markov chain Monte Carlo (MCMC) sampling, specifying 4 chains of 2,000 iterations with 1,000 warm-up iterations (4,000 post warm-up draws per imputation). We set the target acceptance probability (delta) to 0.99 to facilitate convergence. We report all posterior mean or median summaries, posterior probabilities of direction and the credible intervals between the 2.5th and 97.5th percentiles. To evaluate convergence, we used a conservative approach tailored for multiply imputed models. We computed R-hat separately for each imputed dataset and report the highest value observed across imputations (Supplementary Table 31). We also inspected the number of divergent transitions and visually inspected trace plots, R-hat histograms and stratified posterior predictive checks (Supplementary Figs. 34–38).
All analyses were adjusted using weights for random probability samples and included three stages: (1) inverse probability weights to account for the variation in design; (2) non-response weights to reduce bias; and (3) post-stratification weights to account for differences between the sample and target internet-using population distributions. All reported estimates and counts are survey-weighted (unless mentioned otherwise). Further details about our sample weights and design are provided in Supplementary Table 2. Missing data ranged from 0.2% to 33.8% across variables (Supplementary Table 11). All missing data for the independent variables were imputed using the multiple imputation by chained equations (MICE) method and the mice package in R95. MICE was used as it accommodates both continuous and categorical variables flexibly and is well suited to the complexity of the dataset. We ran 30 imputations of the analysis and pooled results across all datasets to ensure robust estimation. All main models were estimated using the brms93 R package for Bayesian estimation. All graphs were created using ggplot296 and ggdist97. All diagnostics were checked using the Bayesplot98 package.
Deviation from the pre-registration
We deviated from the pre-registrated analysis plan in several ways. First, although we preregistered one confirmatory logistic regression model (our preregistered hypothesis is shown in the ‘Predictors of disclosure’ section) and four exploratory models (interaction, random intercepts, comparing formal versus informal channels and regularized regression), we did not interpret the GLM as the test of our confirmatory analysis. We extended the preregistered exploratory random-intercept model into a Bayesian random intercepts and slopes model. This allowed us to (1) factor in the heterogeneity in the relationship between the set of predictors and disclosure; (2) provide more nuanced uncertainty estimation; and (3) reflect the empirical expectation that effects will not be homogeneous across these diverse countries in Asia and Africa. Owing to this expected heterogeneity, we judged this extension to be theoretically and methodologically appropriate. All preregistered and exploratory models with missing data and imputed models are reported in Supplementary Tables 10, 12, 13, 21–23 and 25–30 and Supplementary Fig. 33. Second, given that conceptual frameworks for technology-facilitated CSEA are still emerging and considering the lack of standardization in how such harms are measured and categorized19, we analysed each reported type of sexual harm (that occurred on social media or in an online game) separately. We had initially divided the nine measures into three categories (the previous categorization is shown in Supplementary Fig. 16). However, it was challenging to clearly delineate the boundaries between possible and grave instances of forms of sexual exploitation and abuse, and we wanted to avoid conflating these categories or introducing measurement error. Our final terminology was informed by the updated guidelines by the Working Group for the Revision of the Terminology Guidelines for the Protection of Children from Sexual Exploitation and Sexual Abuse (the Luxembourg Guidelines)18.
Third, we extended the scope of our analysis to add a core model to estimate the probability of children experiencing technology-facilitated CSEA and unpack the associations with key demographic factors. Fourth, we excluded the perpetrator’s identity (for example, unknown, known romantic, known family, known other) from the main model due to substantial conceptual and reporting overlap between categories (that is, many children reported multiple perpetrators) (Supplementary Fig. 19 and Supplementary Tables 43 and 44). This was initially preregistered as an interpersonal predictor. Instead, we reclassified enabling parental mediation, which was also preregistered after revisiting the literature as an interpersonal (family-level) predictor. Fifth, we had preregistered to run an exploratory analysis using the LASSO regularized regression. However, the underlying brms package (v.2.19.2) no longer supports the LASSO prior, and we use a Horseshoe prior instead. Finally, we did not implement backward stepwise selection or bootstrapping; instead, model comparison was conducted by PSIS-LOO cross-validation91 and uncertainty was quantified through posterior distributions (Supplementary Tables 20 and 24 and Supplementary Figs. 22 and 29).
Reporting summary
Further information on research design is available in the Nature Portfolio Reporting Summary linked to this article.

