The ability to recognize objects is fundamental to the survival of visual animals. The primate ventral stream has long served as a model for studying how objects are processed in the brain10,11. One defining feature of the primate ventral stream is hierarchical organization12, which is mirrored by deep neural networks (DNNs) trained on object recognition8,13. This parallel raises an important question: is hierarchical representation necessary and, if so, can it be found across all highly visual mammalian species? Investigating visual processing across different mammalian species promises to provide a deeper understanding of general principles for object vision.
Over a decade ago, the mouse visual system began to attract strong interest, driven by the wealth of tools available for mouse neural circuit dissection14,15. However, the mouse’s low visual acuity and limited cortical territory dedicated to vision16 make it a non-ideal organism for studying hierarchical brain mechanisms underlying object recognition. The tree shrew has attracted growing interest as a model to study visual processing17 owing to its high visual acuity (more than ten times that of rodents)18, greatly expanded visual cortex19 and excellent ability to perform visually guided behavioural tasks compared with the mouse20,21. The tree shrew visual system includes at least nine distinct anatomical visual cortical areas19. The primary visual area (V1) shows a high degree of functional specialization, including an orderly arrangement of orientation-selective columns22,23. The tree shrew also has a prominent second visual area (V2), albeit with a large-scale topographic organization that differs from that of primates24. Lesion studies suggest a rough correspondence between tree shrew extrastriate areas anterior to V2 and primate IT cortex: ablations of large portions of the temporal lobe produce deficits in pattern discrimination and object vision similar to the effects of inferotemporal (IT) lesions in primates19,25,26. However, to our knowledge, there have been no electrophysiological studies of the functional properties of tree shrew extrastriate visual areas beyond V2.
Here we aim to identify the cortical organization and coding principles that underlie visual object representation across the entire tree shrew ventral stream. Using large-scale electrophysiological recordings with several Neuropixels probes, we surveyed five tree shrew ventral visual areas as well as the pulvinar. We confirmed hallmarks of hierarchical organization found in primates, including increased receptive field size and response latency27 as well as increased selectivity for naturalistic textures compared with spectrally matched noise5. We found that area V2 in the tree shrew performs key functions associated with primate IT cortex. This includes a full representation of high-level object space, accurate object identity decoding and reconstruction, and the presence of strongly face-selective cells. Overall, the results indicate a compressed, multi-stage hierarchy in the tree shrew in which representations previously observed in the primate are realized at a much earlier stage of visual processing.
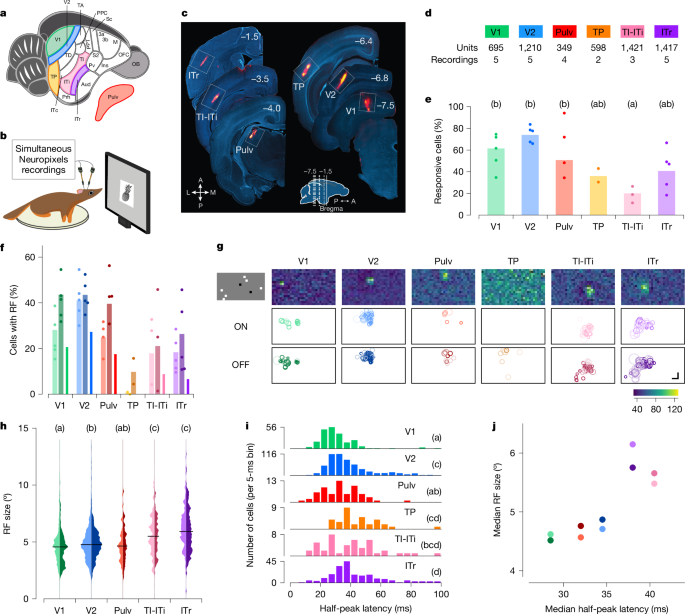
We targeted a set of areas spanning the tree shrew ventral stream to investigate hierarchical visual processing (Fig. 1a). We included primary (V1) and secondary (V2) visual areas as architectonically distinct regions involved in early stages of visual processing28,29. As a potential intermediate node along the ventral visual processing stream, we selected the temporal posterior (TP) area. At the anterior end, we focused on three subregions that may be homologous to macaque IT cortex: temporal-inferior (TI), temporal intermediate (ITi) and inferotemporal rostral (ITr) areas. Lesions to TI and ITi cause drastic impairments in visual form detection25. ITr receives inputs from both visual and auditory cortex19, but its visual functional properties have never been explored, to our knowledge. Owing to the difficulty in distinguishing the border between TI and ITi, we grouped them together and refer to this region as TI-ITi. Because many temporal areas receive direct input from the thalamus30, we also included the dorsal visual portion of the pulvinar (Pulv) in our recordings. To guide electrode targeting, we performed retrograde tracing experiments (Extended Data Fig. 1a,b).
a,b, Schematic of a tree shrew brain (a) and head-fixed electrophysiological recordings with Neuropixels probes (b). c, Representative electrode tracks marked with DiI (red) in each targeted area. Numbers indicate rostrocaudal position relative to Bregma (inset). A, anterior; L, lateral; M, medial; P, posterior. d, Number of recordings and total units across each area. e, Percentage of visually responsive cells to any of the presented visual stimuli in each area (Methods). Dots indicate individual recordings, bars indicate averages across recordings. Letters in this and subsequent panels indicate Tukey grouping. Tukey analysis (α = 0.05) after ANOVA, F5,18 = 5.362, P = 0.003). f, Percentage of visually responsive units (see Fig. 1e) showing receptive fields (RFs). Left (lighter, ON), centre (darker, OFF) and right (ON/OFF) bars for each area. Dots indicate individual recording sessions. g, Distribution of receptive field locations across the visual field. Top row, receptive field maps for example units, one per area. Middle and bottom rows show the position and sizes of all ON and OFF receptive fields (respectively) in a representative recording. Shading indicates receptive field quality (Methods). Each white box represents ±54° horizontally and ±38° vertically. Top left, one frame of sparse noise stimulus used to map receptive fields. h, Distribution of ON (left, lighter) and OFF (right, darker) receptive field sizes for each area. Tukey analysis (α = 0.05) after ANOVA, F4,1540 = 36.544, P < 10−28; TP was excluded from this analysis because of the very low number of cells with receptive fields in this area. i, Histogram of the latencies to half-peak response in visually responsive cells in each area. Tukey analysis (α = 0.05) after ANOVA F5,1147 = 20.197, P < 10−18. j, Comparison of the hierarchy inferred from receptive field size (y axis) and response latency (x axis). Each dot represents the median of the data for a given area (hue), with ON and OFF receptive fields represented by light and dark dots, respectively. Scale bar, 15°.
To characterize the visual responses of neurons across V1, V2, TP, TI-ITi, ITr and Pulv, we performed electrophysiological recordings using Neuropixels probes in awake tree shrews (Fig. 1b). During each experiment, animals were head-fixed in front of a monitor and presented with a battery of visual stimuli, including local sparse noise, static gratings, naturalistic textures and noise, and images of faces and other objects. At the conclusion of each session, probe locations were marked with DiI (DiIC18(3), a fluorescent dye) and targeting was confirmed with histology (Fig. 1c). We classified a cell as visually responsive if it responded to any of the classes of visual stimuli we tested (Methods). We found many well-isolated single units in each area (Fig. 1d), with some inter-area differences in the fractions of cells that responded to visual stimuli (ANOVA, F5,18 = 5.362, P = 0.003; Fig. 1e). In particular, significantly fewer TI-ITi cells were visually responsive compared with V2 cells.
We began by mapping the receptive fields of neurons along the tree shrew ventral pathway using a locally sparse noise stimulus (Methods). For each neuron, we estimated the receptive field by fitting a Gaussian distribution to the two-dimensional (2D) matrix of spike counts across visual field locations; ON and OFF receptive fields were computed separately using responses to white and black squares, respectively. Cells with ON and/or OFF receptive fields were clearly present in all areas except TP (Fig. 1f). This included the two most anterior areas TI-ITi and ITr; this contrasts with the anterior temporal lobe in primates, where neurons typically show spatially invariant responses31,32.
Within individual recordings, receptive field positions were clustered in a small portion of the visual field, corresponding to the retinotopic region represented by the cortical site targeted with the electrode. Figure 1g shows receptive fields of all recorded cells in a representative session for each area. This clustering was evident across all areas studied, including the most anterior areas, TI-ITi and ITr. This finding suggests that, despite their position at the anterior end of the ventral stream, these areas preserve retinotopic organization.
To assess the hierarchical relationships between the recorded areas, we first examined two classic metrics of hierarchical level: receptive field size and visually evoked response latency. Receptive field sizes increased systematically from posterior to anterior (Fig. 1h). We also calculated the half-peak latencies for each unit in each area and found that latencies increased from V1 to V2 to ITr (Fig. 1i and Methods). The hierarchy predicted by the increase in receptive field sizes was broadly consistent with the hierarchy predicted by the increase in latencies (Fig. 1j).
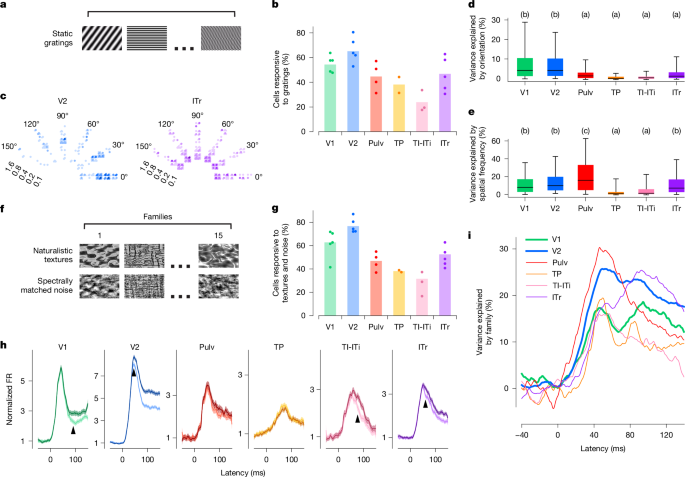
In the primate visual cortex, early visual areas are strongly tuned to low-level features such as orientation and spatial frequency, whereas later areas are tuned to more complex object features7,33,34,35. To examine whether a similar progression exists in the tree shrew, we assessed tuning to orientation and spatial frequency across ventral visual areas using static gratings (Fig. 2a). We found that the proportion of visually responsive neurons (see Fig. 1e) that responded to gratings was the highest in V1 and V2 (roughly 55% and 65%, respectively) and lowest in TI-ITi (Fig. 2b). Tuning to orientation, spatial frequency and phase of example cells from V2 and ITr illustrates the diverse tuning we observed to these variables across tree shrew visual areas (Fig. 2c). Overall, orientation tuning was most prevalent in V1 and V2 (Tukey analysis after ANOVA, F5, 1,106 = 26.791, P < 10−24, Fig. 2d), whereas spatial frequency tuning was also prevalent in ITr (Tukey analysis ANOVA, F5, 1106 = 20.514, P < 10−18, Fig. 2e). These findings are roughly consistent with those found in the primate and rodent ventral stream, where orientation tuning is especially prominent in early visual areas and then sharply decreases in later areas36,37,38,39.
a, Example frames of static grating stimuli. Stimuli were varied in orientation, spatial frequency and phase, and were interleaved with grey frames. b, Percentage of visually responsive cells (see Fig. 1e) that responded to static gratings in individual recording sessions (dots) and averaged across recording sessions (bars). c, Responses of a representative V2 and ITr cell to static gratings differing in orientation (represented circumferentially), spatial frequency (represented radially, cycles per degree) and phase (four small quadrants). Each dot represents a single trial; colour intensity represents responses strength. d, Percentage of variance of individual cells’ responses explained by orientation of the stimulus. Boxes represent 25th, 50th and 75th percentile; whiskers 5th and 95th. Letters in this and subsequent panels indicate Tukey grouping. Tukey analysis (α = 0.05) after ANOVA, F5, 1106 = 26.791, P < 10−24. Number of cells: V1 186, V2 500, Pulv 68, TP 79, TI-ITi 51 and ITr 228. e, Same for spatial frequency. Tukey analysis (α = 0.05) after ANOVA, F5, 1106 = 20.514, P < 10−18 (same cells as d). f, Example frames of naturalistic texture (top) and spectrally matched noise (bottom). g, Percentage of visually responsive cells (see Fig. 1e) that responded to naturalistic texture or spectrally matched noise stimuli in individual recording sessions (dots) and averaged across recording sessions (bars). h, Time courses of population responses in each area to naturalistic texture (darker lines) and spectrally matched noise (lighter lines). Black arrows indicate the latency at which the two curves first significantly differed from each other (two-tailed t-test, P < 0.01). Shaded areas are standard errors of averages across cells. i, Percentage of variance in neural activity explained by texture image family (15 classes, see Fig. 2f).
Thus far, V2 responses seemed largely similar to those in V1, raising the question whether V2 performs any distinct computational function. In macaques, sensitivity to higher-order statistical dependencies in naturalistic textures has been identified as a distinguishing feature of area V2 (ref. 5). We therefore asked whether tree shrew extrastriate areas show a similar specialization for naturalistic texture processing. To test this, we recorded neural activity across all six visual areas while presenting naturalistic textures and spectrally matched synthetic noise images (Fig. 2f and Methods). Among all areas, V2 contained the highest proportion of cells that responded to the texture and/or noise stimuli (Fig. 2g). Population response dynamics revealed the strongest differential activity between naturalistic textures and noise in V2, followed by V1, ITr and TI-ITi, with minimal or no modulation in the remaining areas (Fig. 2h). In V2, the difference persisted for the duration of the stimulus. Although responses in V1 commenced well before those in V2 (Fig. 1i), the divergence between texture and noise responses occurred later in V1 (at 90 ms) than in V2 (at 45 ms), suggesting that the texture modulation in V1 may arise through feedback from V2. This interpretation is further supported by the finding that V2 encoded texture family identity earlier than V1 (Fig. 2i).
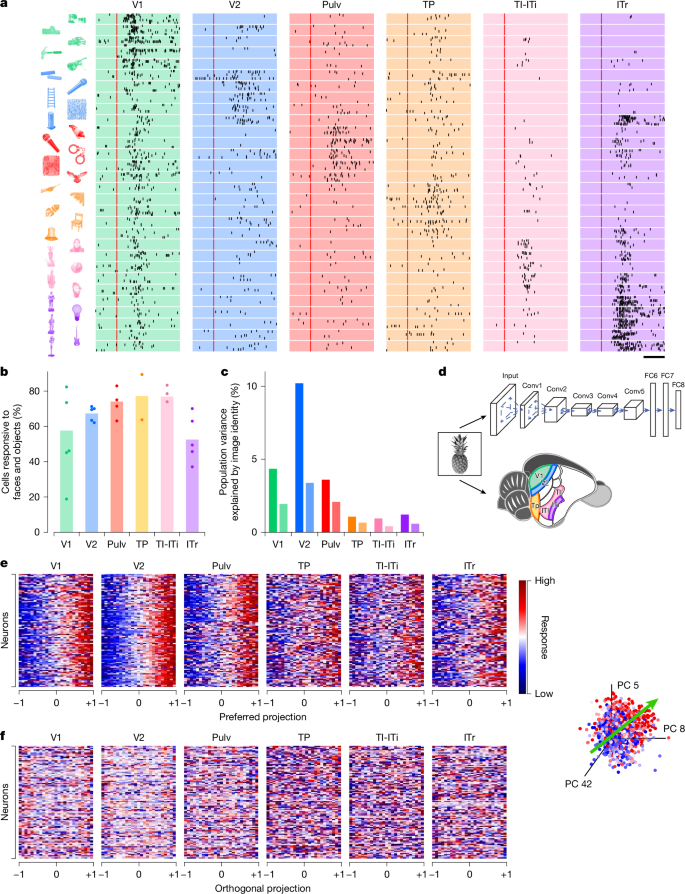
A central function of the visual hierarchy is to recognize and categorize objects to guide vital behaviours such as navigation, foraging or mating. To investigate high-level object representations in the tree shrew ventral stream, we presented a rich stimulus set consisting of 1,593 images of animals, body parts, faces and everyday objects (Methods). This same stimulus set has previously been used to characterize tuning in macaque inferotemporal (IT) cortex, enabling direct comparisons between object recognition mechanisms in primates and tree shrews8. Stimuli were adjusted to match the receptive field location of recorded neurons (Methods). Response rasters from example cells showed diversity in object selectivity across different neurons in the tree shrew ventral stream (Fig. 3a). Among the six areas recorded, a similar proportion of visually responsive cells responded to object stimuli across V2, TP, TI-ITi and Pulv (Fig. 3b). Notably, a much larger fraction of visually responsive cells in TI-ITi responded to object stimuli compared with gratings (Fig. 2b), consistent with temporal areas occupying a higher level in the visual hierarchy. To quantify the reliability of object-driven responses, we computed the ‘explainable variance’—the portion of neural response variance attributable to stimulus identity rather than trial-to-trial variability (Methods). After V2, the explainable variance in responses to these complex object stimuli decreased notably (Fig. 3c), indicating that responses in more anterior areas were less consistent across trials. To determine whether the explainable variance could be accounted for by low-level visual features, we analysed the contributions of luminance, contrast and spatial frequency; in each area, only a small fraction of the variance could be explained by such features (Fig. 3c and Extended Data Fig. 2).
a, Spike raster plots for representative visually active cells from each of the areas in response to six groups of object stimuli, each optimal for one of the cells (stimuli shown on the left). Each dot represents an action potential in one of up to ten presentations of the stimulus; red line indicates stimulus onset. b, Percentage of visually responsive cells (see Fig. 1e) that responded to object stimuli in individual recording sessions (dots) and averaged across recording sessions (bars). c, Percentage of variance of neural responses explained in each area by object stimulus identity (left bars) and by low-level feature image indices (right bars). d, Schematic illustrating the processing of visual stimuli in layers of the artificial neural network AlexNet (top) and in areas of the tree shrew ventral visual pathway (bottom). e, Normalized neural responses to object images for 100 randomly selected cells in each of the six areas as a function of position of that image along the given neuron’s preferred axis in AlexNet FC6 space (object space). The x axis is rescaled so that the range [−1,1] covers 98% of the stimuli. Inset, preferred axis (green arrow, Methods) of a representative cell (area V2) in object space. The coordinate axes represent the three AlexNet principal components (PCs) that most align with the cell’s preferred axis. Each dot represents an image, colour coded by the strength of the cell’s response to that image (blue, low; red, high). f, Responses as a function of normalized position along each cell’s principal orthogonal axis, that is, the axis in object space orthogonal to the neuron’s preferred axis that captured the most variance in AlexNet activations (Methods). Scale bar, 50 ms. Object images in panel a used with permission from ref. 8, Springer Nature Limited.
To better understand the nature of the neural code used by each area, we modelled neural responses using AlexNet40, an eight-layer DNN trained on object recognition (Fig. 3d). In macaques, single IT neurons are well described by an ‘axis model’, in which each cell linearly projects incoming stimuli onto a preferred axis in a DNN-derived feature space8,13. In these models, the preferred axes span a relatively low-dimensional basis—such that, for example, just 50 dimensions are sufficient for accurate reconstructions of faces from macaque face patches41. To test whether this principle also applies in the tree shrew, we computed the preferred axis of each neuron across six recorded areas using the first 50 principal components from AlexNet layer FC6. We focused on FC6 to clarify whether tree shrew cortex represents a high-level object space, as observed in macaque IT cortex8. Consistent with axis-based coding, neurons in all six areas showed ramp-shaped tuning along their preferred axes (Fig. 3e and Methods). Moreover, cells showed flat tuning along their principal orthogonal axis (that is, longest axis orthogonal to the preferred axis; Fig. 3f and Methods).
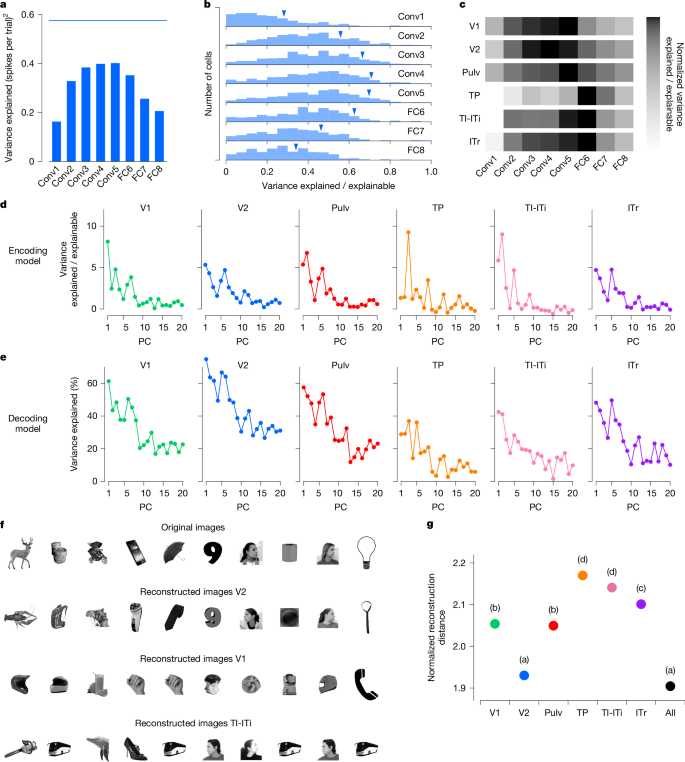
Previous studies in primates have shown that early layers of AlexNet and other DNNs best explain neuronal activity in early retinotopic visual areas, whereas later layers best explain responses in IT cortex8,13. We asked whether a similar pattern holds across the tree shrew ventral stream. To test this, we regressed single-cell firing rates against the first 50 principal components of each layer in AlexNet (Methods) and identified the layer that best explained the variance in each cell’s response. For one representative cell in V2, AlexNet layer Conv4 best explained its responses (Fig. 4a). Across the V2 population, we found that intermediate layers—specifically Conv4 and Conv5—consistently had greater explanatory power than either early or late layers (Fig. 4b).
a, Variance of the responses of a representative V2 cell explained by individual AlexNet layers. Blue line shows the explainable variance of the cell. b, Histograms of explained variance by different layers of AlexNet for responses of visually responsive cells (n = 602) in area V2. Blue triangles mark values for the cell from a. c, Normalized explained variance by AlexNet layers for each tree shrew visual area (Methods). d, Variance of encoded neural activity in different areas explained by individual AlexNet FC6 principal components (PCs) as a percentage of explainable variance in that area. e, Percentage of variance of AlexNet FC6 features that can be explained by decoding from the neural responses in different areas. f, Ten examples of original images presented to the tree shrew and the images reconstructed from V2, V1 and TI-ITi: that is, the closest images to the predicted responses from AlexNet FC6 from an auxiliary database of images that were not shown to the animal (Methods). g. Average decoding distance for each tree shrew visual area between AlexNet FC6 activations predicted from neural activity and actual activations for each image, normalized by theoretical best decoding distance (Methods). Tukey analysis (α = 0.05) after ANOVA, F6,11144 = 151.248, P < 10−184. Object images in panel f used from ref. 8, Springer Nature Limited.
To compare the explanatory power of different AlexNet layers across brain areas, we calculated the sum across cells within each area of the variance explained by the various AlexNet layers, and normalized these sums by the sum across cells of their explainable variance (Methods). This analysis revealed that early visual areas V1 and V2 were best explained by intermediate layers—specifically Conv3 to Conv5—whereas anterior areas TI-ITi and ITr were best explained by the high-level FC6 layer (Fig. 4c). However, the absolute variance explained by AlexNet was lower in these higher cortical areas (Extended Data Fig. 3a,b), consistent with the reduced trial-to-trial reliability of responses to object identity observed in anterior regions (Fig. 3c). One possible explanation is that AlexNet may lack the expressive capacity to fully capture response properties of anterior tree shrew regions, which have been proposed to be multimodal and not exclusively visual19
To investigate which feature axes accounted for the most variance in neural responses across areas, we examined how much variance was explained by individual feature principal components from AlexNet layer FC6. In general, earlier principal components explained the greatest proportion of variance in neural responses, with some variability across areas (Fig. 4d). We also analysed how well specific FC6 features could be decoded from population activity in each visual area (Fig. 4e). Again, early principal components were most strongly represented, with decoding performance peaking in V2, substantially higher than in any other region. This finding aligns with the observation that FC6 features explained more variance in V2 than in other areas (Extended Data Fig. 3c). Thus, even though V2 was best explained by Conv4 and Conv5 features, whereas TI-ITi and ITr were best explained by FC6 features, FC6 features were nevertheless better represented in V2 than in these more anterior areas.
Given the strong performance of V2 in decoding AlexNet FC6 features, we next asked whether activity in V2 might be sufficient to reconstruct objects using small neural populations, as has previously been shown in monkey IT cortex8. To test this, we used a large auxiliary dataset of 15,901 images, each passed through AlexNet to extract FC6 activations. From activity in each area, we reconstructed an FC6 activation vector and identified the image whose FC6 features were closest to the reconstruction (Extended Data Fig. 3d). To control for cell number, we performed reconstructions using 100 randomly selected cells from each area. Consistent with our results on parameter decoding (Fig. 4e), which were optimal in V2, images reconstructed from V2 closely resembled the original images, whereas images reconstructed from V1 or TI-ITi were notably less accurate (Fig. 4f). To quantitatively compare reconstruction accuracy across areas, we computed the distance between the reconstructed and actual FC6 activation vectors for each image, normalized by the theoretical best decoding distance (Methods). This analysis revealed that V2 had the smallest normalized decoding distances of all areas—indicating the most accurate reconstructions—and matched the performance obtained when pooling neurons from all areas combined (Tukey analysis after ANOVA, F6, 11144 = 151.248, P < 10−184; Fig. 4g). These results further underscore the rich yet compact object representation present in tree shrew V2.
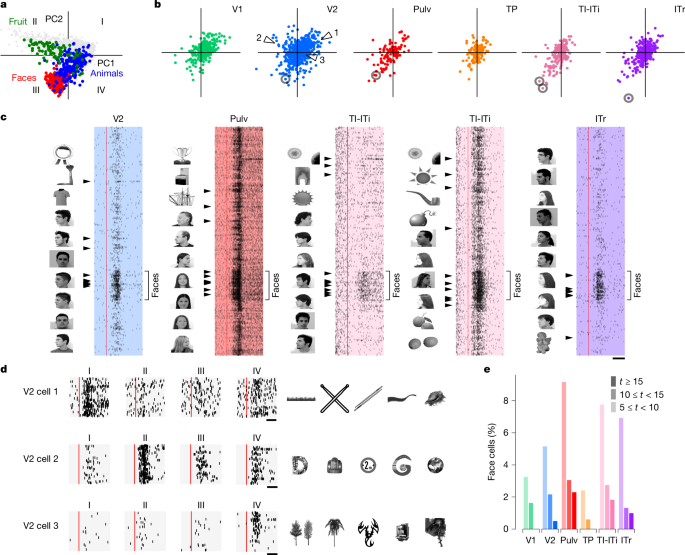
Primate IT cortex contains regions composed of neurons that respond maximally to images from specific categories, for example, faces42,43,44. Such category-selective regions can be explained by a normative framework in which IT cortex encodes a general object space—a representational space defined by the first two principal components of the AlexNet FC6 features8,45. Within this space, different sectors correspond to distinct object categories, such as faces, fruits and animals (Fig. 5a).
a, Projections of 1,593 object images onto object space (the first two principal components from AlexNet layer FC6) with images from several categories (faces, animals, fruits) indicated. b, Projections of the preferred axes of all cells onto object space. c, Raster plots of several representative face-selective cells (circled in b) responding to face and object stimuli. The ten most preferred images for each cell are shown to the left of each raster. Arrowheads mark responses to those images. Red lines show stimulus onset. d, Raster plots of three representative V2 cells (arrowheads in b) with preferred axes in quadrants I, II and IV. Twenty stimuli from each quadrant were randomly chosen to generate raster plots. Right, top five preferred images for each cell. e, Histograms of t scores for face selectivity across areas. Scale bars, 50 ms (c), 50 ms (d). Object images in panels c and d used from ref. 8, Springer Nature Limited.
Does the tree shrew visual cortex, like the primate IT cortex, contain regions specialized for representing distinct sectors of object space? To address this question, we projected the preferred axes of all recorded cells onto the same 2D object space (Fig. 5b). In V2, preferred axes were distributed across all four quadrants, whereas in other areas, they were largely confined to quadrants I and III. Given that different object categories are localized to distinct regions of this space, we predicted that individual tree shrew neurons would show selectivity for specific categories. Indeed, analysis of response rasters confirmed that neurons with preferred axes in the face sector were strongly face selective (Fig. 5c). Some face cells also responded to other round shapes, whereas others showed strong selectivity only for faces. In addition to face cells, we identified neurons selective for spiky, elongated objects (quadrant I), round inanimate objects (quadrant II) and spiky animate objects (quadrant IV) (Fig. 5d and Extended Data Fig. 4a,b). However, unlike the modular organization seen in primate IT, we found no evidence for topographic clustering of category-selective neurons within tree shrew visual areas (Extended Data Fig. 4c).
Faces—particularly human faces, which comprised all our face stimuli—are not known to hold special behavioural importance for tree shrews46. To confirm that the cells were genuinely face selective, we computed a face selectivity index, defined as the difference between responses to faces and all other objects, for each individual cell (Methods). This confirmed small populations of highly face-selective cells (t ≥ 15) in most areas starting in area V2, with the highest percentages in TI-ITi and Pulv (Fig. 5e).
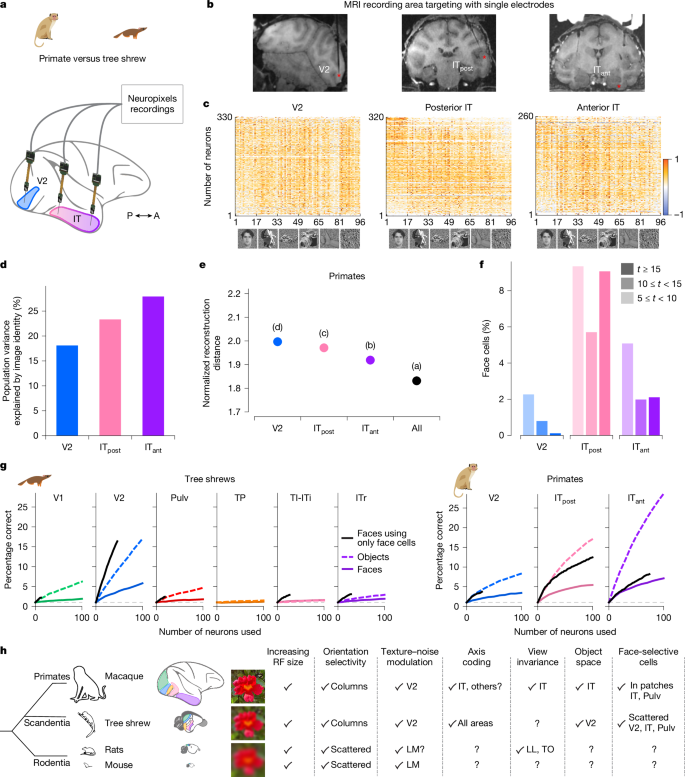
Primate IT cortex is highly specialized for object recognition and has long served as a foundation for studying visual form processing. To enable direct comparisons with our tree shrew dataset, we performed large-scale recordings in macaque monkeys using NHP Neuropixels probes. We presented the same 1,593 object stimuli while recording from V2, posterior IT (ITpost) and anterior IT (ITant) from two monkeys per area (Fig. 6a–c). We found that the explainable variance in responses to complex object stimuli increased along the primate visual hierarchy, from primate V2 to ITant (Fig. 6d), whereas in tree shrew visual cortex, it peaked in V2 (Fig. 3c). Similarly, image reconstruction performance improved along the primate hierarchy (Fig. 4g), whereas in tree shrews, it was most accurate in V2 (Fig. 6e). In contrast to tree shrews (Fig. 5e), we did not observe strongly face-selective cells in primate V2 (Fig. 6f). As expected, the number of face cells in primate ITpost and ITant was much higher. Notably, in one of the ITpost recordings, the probe partially targeted a known face patch, resulting in a higher proportion of face cells.
a, Schematic of recordings in primate. b, Simultaneous Neuropixels recordings from three nodes in macaque monkey cortex. Neuropixels NHP 1.0 probes were inserted into V2, posterior IT and anterior IT cortex. c, Responses of cells in V2, posterior IT and anterior IT, respectively (rows), to 96 stimuli composed of faces and objects (columns). Only visually responsive cells were included (two-tailed t-test, P < 0.05). d, Percentage of variance of neural responses explained by object stimulus identity in each area. e, Average decoding distance for each visual area between AlexNet FC6 activations predicted from neural activity and actual FC6 activations for each image, normalized by theoretical best decoding distance (Methods). f, Histograms of t-scores for face selectivity across areas. g, Decoding performance for individual object identity (dashed lines) or face identity (solid lines) as a function of number of cells used by the classifier. Note the overlap of the two lines for TI-ITi. Black lines indicate decoding performance for face identity using only face cells (t > 5). Dashed grey lines show chance level for object decoding. h, Schematic comparing macaque, tree shrew and rodent visual systems. Object images in panel c used from ref. 8, Springer Nature Limited.
Last, we asked how well neural populations in the primate and tree shrew visual systems could decode individual face or object identity. To test this, we trained classifiers to decode the identity of either 100 faces or 100 general objects using neural activity from randomly sampled subpopulations within each area (Fig. 6g and Methods). In tree shrews, all areas except TP showed above-chance decoding performance for both faces and objects. When we restricted the analysis to only face-selective cells, face identity decoding improved further. Decoding performance in tree shrew V2 exceeded that in all other tree shrew areas for both face and object identity. By contrast, primate V2 showed substantially lower decoding performance compared with tree shrew V2 (Fig. 6g). Indeed, decoding using tree shrew V2 activity was similar to that of primate posterior IT. As expected, primate anterior IT, which sits at the apex of the primate ventral visual hierarchy, showed the highest decoding accuracy.
A hallmark of the primate ventral stream is gradual emergence of view invariance, raising the question of whether a similar progression exists in tree shrews8,31,47. Using DNN models, we computed a predicted view invariance index (Methods) based on responses to the 1,593 object images. In macaques, this predicted index was positively correlated with the empirically measured view invariance index, and both increased along the ventral hierarchy (Extended Data Fig. 5a–c). Applying the same approach to tree shrews, we found no such trend in the model-predicted responses (Extended Data Fig. 5d,e). This absence of a clear progression suggests that view invariance may not emerge in the same hierarchical manner—or may not be captured by current models—in the tree shrew ventral stream. However, direct empirical testing within each area is needed to determine whether view invariance is a core organizing principle of the tree shrew visual pathway, as it is in primates32 and rodents48,49. Taken together, our findings show how visual processing along a series of interconnected areas in tree shrews compares to primates5,7,8,9,13,32 and rodents50,51,52, highlighting both important similarities and differences (Fig. 6h).


