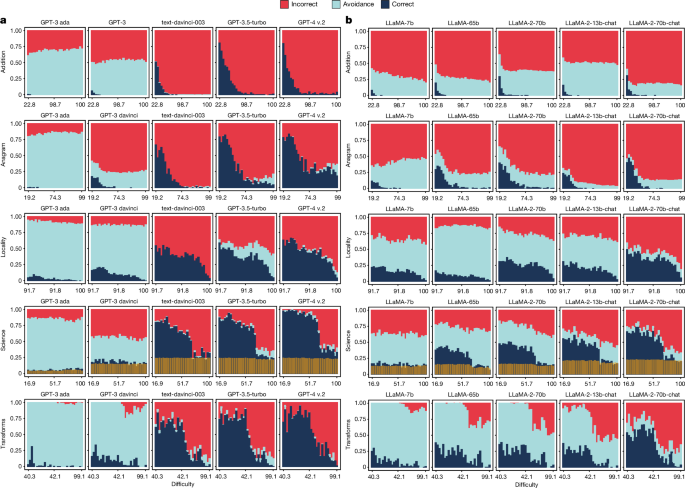
Figure 2 shows the results of a selection of models in the GPT and LLaMA families, increasingly scaled up, with the shaped-up models on the right, for the five domains: âadditionâ, âanagramâ, âlocalityâ, âscienceâ and âtransformsâ. We see that the percentage of correct responses increases for scaled-up, shaped-up models, as we approach the last column. This is an expected result and holds consistently for the rest of the models, shown in Extended Data Fig. 1 (GPT), Extended Data Fig. 2 (LLaMA) and Supplementary Fig. 14 (BLOOM family).
The values are split by correct, avoidant and incorrect results. For each combination of model and benchmark, the result is the average of 15 prompt templates (see Supplementary Tables 1 and 2). For each benchmark, we show its chosen intrinsic difficulty, monotonically calibrated to human expectations on the x axis for ease of comparison between benchmarks. The x axis is split into 30 equal-sized bins, for which the ranges must be taken as indicative of different distributions of perceived human difficulty across benchmarks. For âscienceâ, the transparent yellow bars at the bottom represent the random guess probability (25% of the non-avoidance answers). Plots for all GPT and LLaMA models are provided in Extended Data Figs. 1 and 2 and for the BLOOM family in Supplementary Fig. 14.
Let us focus on the evolution of correctness with respect to difficulty. For âadditionâ, we use the number of carry operations in the sum (fcry). For âanagramâ, we use the number of letters of the given anagram (flet). For âlocalityâ, we use the inverse of city popularity (fpop). For âscienceâ, we use human difficulty (fhum) directly. For âtransformsâ, we use a combination of input and output word counts and Levenshtein distance (fw+l) (Table 2). As we discuss in the Methods, these are chosen as good proxies of human expectations about what is hard or easy according to human study S1 (see Supplementary Note 6). As the difficulty increases, correctness noticeably decreases for all the models. To confirm this, Supplementary Table 8 shows the correlations between correctness and the proxies for human difficulty. Except for BLOOM for addition, all of them are high.
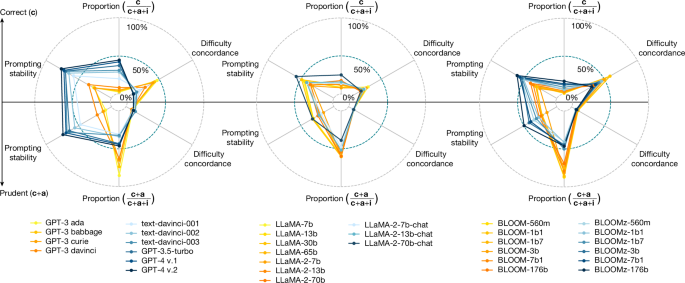
However, despite the predictive power of human difficulty metrics for correctness, full reliability is not even achieved at very low difficulty levels. Although the models can solve highly challenging instances, they also still fail at very simple ones. This is especially evident for âanagramâ (GPT), âscienceâ (LLaMA) and âlocalityâ and âtransformsâ (GPT and LLaMA), proving the presence of a difficulty discordance phenomenon. The discordance is observed across all the LLMs, with no apparent improvement through the strategies of scaling up and shaping up, confirmed by the aggregated metric shown in Fig. 1. This is especially the case for GPT-4, compared with its predecessor GPT-3.5-turbo, primarily increasing performance on instances of medium or high difficulty with no clear improvement for easy tasks. For the LLaMA family, no model achieves 60% correctness at the simplest difficulty level (discounting 25% random guess for âscienceâ). The only exception is a region with low difficulty for âscienceâ with GPT-4, with almost perfect results up to medium difficulty levels.
Focusing on the trend across models, we also see something more: the percentage of incorrect results increases markedly from the raw to the shaped-up models, as a consequence of substantially reducing avoidance (which almost disappears for GPT-4). Where the raw models tend to give non-conforming outputs that cannot be interpreted as an answer (Supplementary Fig. 16), shaped-up models instead give seemingly plausible but wrong answers. More concretely, the area of avoidance in Fig. 2 decreases drastically from GPT-3 ada to text-davinci-003 and is replaced with increasingly more incorrect answers. Then, for GPT-3.5-turbo, avoidance increases slightly, only to taper off again with GPT-4. This change from avoidant to incorrect answers is less pronounced for the LLaMA family, but still clear when comparing the first with the last models. This is summarized by the prudence indicators in Fig. 1, showing that the shaped-up models perform worse in terms of avoidance. This does not match the expectation that more recent LLMs would more successfully avoid answering outside their operating range. In our analysis of the types of avoidance (see Supplementary Note 15), we do see non-conforming avoidance changing to epistemic avoidance for shaped-up models, which is a positive trend. But the pattern is not consistent, and cannot compensate for the general drop in avoidance.
Looking at the trend over difficulty, the important question is whether avoidance increases for more difficult instances, as would be appropriate for the corresponding lower level of correctness. Figure 2 shows that this is not the case. There are only a few pockets of correlation and the correlations are weak. This is the case for the last three GPT models for âanagramâ, âlocalityâ and âscienceâ and a few LLaMA models for âanagramâ and âscienceâ. In some other cases, we see an initial increase in avoidance but then stagnation at higher difficulty levels. The percentage of avoidant answers rarely rises quicker than the percentage of incorrect ones. The reading is clear: errors still become more frequent. This represents an involution in reliability: there is no difficulty range for which errors are improbable, either because the questions are so easy that the model never fails or because they are so difficult that the model always avoids giving an answer.
We next wondered whether it is possible that this lack of reliability may be motivated by some prompts being especially poor or brittle, and whether we could find a secure region for those particular prompts. We analyse prompt sensitivity disaggregating by correctness, avoidance and incorrectness, using the prompts in Supplementary Tables 1 and 2. A direct disaggregation can be found in Supplementary Fig. 1, showing that shaped-up models are, in general, less sensitive to prompt variation. But if we look at the evolution against difficulty, as shown in Extended Data Figs. 3 and 4 for the most representative models of the GPT and LLaMA families, respectively (all models are shown in Supplementary Figs. 12, 13 and 15), we observe a big difference between the raw models (represented by GPT-3 davinci) and other models of the GPT family, whereas the LLaMA family underwent a more timid transformation. The raw GPT and all the LLaMA models are highly sensitive to the prompts, even in the case of highly unambiguous tasks such as âadditionâ. Difficulty does not seem to affect sensitivity very much, and for easy instances, we see that the raw models (particularly, GPT-3 davinci and non-chat LLaMA models) have some capacity that is unlocked only by carefully chosen prompts. Things change substantially for the shaped-up models, the last six GPT models and the last three LLaMA (chat) models, which are more stable, but with pockets of variability across difficulty levels.
Overall, these different levels of prompt sensitivity across difficulty levels have important implications for users, especially as human study S2 shows that supervision is not able to compensate for this unreliability (Fig. 3). Looking at the correct-to-incorrect type of error in Fig. 3 (red), if the user expectations on difficulty were aligned with model results, we should have fewer cases on the left area of the curve (easy instances), and those should be better verified by humans. This would lead to a safe haven or operating area for those instances that are regarded as easy by humans, with low error from the model and low supervision error from the human using the response from the model. However, unfortunately, this happens only for easy additions and for a wider range of anagrams, because verification is generally straightforward for these two datasets.
In the survey (Supplementary Fig. 4), participants have to determine whether the output of a model is correct, avoidant or incorrect (or do not know, represented by the âunsureâ option in the questionnaire). Difficulty (x axis) is shown in equal-sized bins. We see very few areas where the dangerous error (incorrect being considered correct by participants) is sufficiently low to consider a safe operating region.
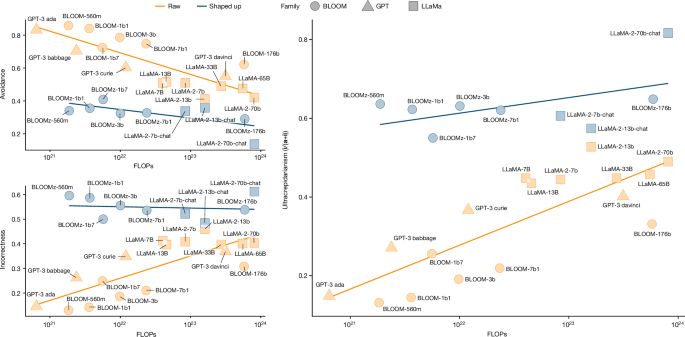
Our observations about GPT and LLaMA also apply to the BLOOM family (Supplementary Note 11). To disentangle the effects of scaling and shaping, we conduct an ablation study using LLaMA and BLOOM models in their shaped-up versions (named chat and z, respectively) and the raw versions, with the advantage that each pair has equal pre-training data and configuration. We also include all other models with known compute, such as the non-instruct GPT models. We take the same data summarized in Fig. 1 (Extended Data Table 1) and perform a scaling analysis using the FLOPs (floating-point operations) column in Table 1. FLOPs information usually captures both data and parameter count if models are well dimensioned40. We separate the trends between raw and shaped-up models. The fact that correctness increases with scale has been systematically shown in the literature of scaling laws1,40. With our data and three-outcome labelling, we can now analyse the unexplored evolution of avoidance and incorrectness (Fig. 4, left).
The plot uses a logarithmic scale for FLOPs. The focus is on avoidance (a; top left), incorrectness (i; bottom left) and ultracrepidarianism (i/(aâ+âi); right)âthe proportion of incorrect over both avoidant and incorrect answers.
As evident in Fig. 4, avoidance is clearly much lower for shaped-up models (blue) than for raw models (orange), but incorrectness is much higher. But even if correctness increases with scale, incorrectness does not decrease; for the raw models, it increases considerably. This is surprising, and it becomes more evident when we analyse the percentage of incorrect responses for those that are not correct in (i/(aâ+âi) in our notation; Fig. 4 (right)). We see a large increase in the proportion of errors, with models becoming more ultracrepidarian (increasingly giving a non-avoidant answer when they do not know, consequently failing proportionally more).
We can now take all these observations and trends into account, in tandem with the expectations of a regular human user (study S1) and the limited human capability for verification and supervision (study S2). This leads to a re-understanding of the reliability evolution of LLMs, organized in groups of two findings for difficulty discordance (F1a and F1b), task avoidance (F2a and F2b) and prompt sensitivity (F3a and F3b):
F1aâhuman difficulty proxies serve as valuable predictors for LLM correctness. Proxies of human difficulty are negatively correlated with correctness, implying that for a given task, humans themselves can have approximate expectations for the correctness of an instance. Relevance: this predictability is crucial as alternative success estimators when model self-confidence is either not available or markedly weakened (for example, RLHF ruining calibration3,41).
F1bâimprovement happens at hard instances as problems with easy instances persist, extending the difficulty discordance. Current LLMs clearly lack easy operating areas with no error. In fact, the latest models of all the families are not securing any reliable operating area. Relevance: this is especially concerning in applications that demand the identification of operating conditions with high reliability.
F2aâscaling and shaping currently exchange avoidance for more incorrectness. The level of avoidance depends on the model version used, and in some cases, it vanishes entirely, with incorrectness taking important proportions of the waning avoidance (that is, ultracrepidarianism). Relevance: this elimination of the buffer of avoidance (intentionally or not) may lead users to initially overtrust tasks they do not command, but may cause them to be let down in the long term.
F2bâavoidance does not increase with difficulty, and rejections by human supervision do not either. Model errors increase with difficulty, but avoidance does not. Users can recognize these high-difficulty instances but still make frequent incorrect-to-correct supervision errors. Relevance: users do not sufficiently use their expectations on difficulty to compensate for increasing error rates in high-difficulty regions, indicating over-reliance.
F3aâscaling up and shaping up may not free users from prompt engineering. Our observations indicate that there is an increase in prompting stability. However, models differ in their levels of prompt sensitivity, and this varies across difficulty levels. Relevance: users may struggle to find prompts that benefit avoidance over incorrect answers. Human supervision does not fix these errors.
F3bâimprovement in prompt performance is not monotonic across difficulty levels. Some prompts do not follow the monotonic trend of the average, are less conforming with the difficulty metric and have fewer errors for hard instances. Relevance: this non-monotonicity is problematic because users may be swayed by prompts that work well for difficult instances but simultaneously get more incorrect responses for the easy instances.
As shown in Fig. 1, we can revisit the summarized indicators of the three families. Looking at the two main clusters and the worse results of the shaped-up models on errors and difficulty concordance, we may rush to conclude that all kinds of scaling up and shaping up are inappropriate for ensuring user-driven reliability in the future. However, these effects may well be the result of the specific aspirations for these models: higher correctness rates (to excel in the benchmarks by getting more instances right but not necessarily all the easy ones) and higher instructability (to look diligent by saying something meaningful at the cost of being wrong). For instance, in scaling up, there is a tendency to include larger training corpora42 with more difficult examples, or giving more weight to authoritative sources, which may include more sophisticated examples43, dominating the loss over more straightforward examples. Moreover, shaping up has usually penalized answers that hedge or look uncertain3. That makes us wonder whether this could all be different.


