


Generation of constructs
Constructs were developed using a modified overlap cloning technique60. Flexible linkers, consisting of glycine–serine repeats (GGGGS), with lengths ranging from 18 to 33 amino acids, were inserted between the coding sequences for fluorescent proteins or luciferases and those of receptors, transducers, biosensors or adaptor proteins. The creation of SmBiT-β-arrestin IP6, AP2 and clathrin mutants used a previously published overlap cloning strategy with SmBiT. The 2xFYVE-mKO construct was created by integrating Cyto-mKO into the 2xFYVE-LgBiT vector via overlap cloning.
Generation of β-arrestin-split GFP
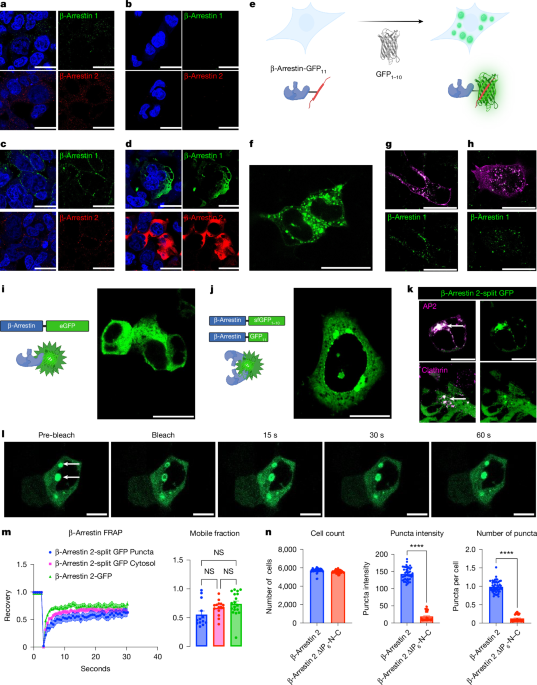
β-Arrestin-split GFP constructs were derived from pcDNA3.1-GFP(1–10) (Addgene no. 70219) and pEGFP-GFP11-Actin (Addgene no. 181966) and cloned into either SmBiT-β-arrestin or β-arrestin-SmBiT.
Generation of stable cell lines
β-Arrestin knock-in cell lines were made by Cyagen. In short, the Arrb1–2 (C terminal linker-GFP11) knock-in HEK293T cells wereseeded into six-well plates and cultured for 24 h. Cas9 nuclease (0.2 nmol) and guide RNAs (0.1 nmol; sequences in Supplementary Table 1) were pre-incubated to assemble ribonucleoprotein complexes, and 0.5 nmol of donor vector was electroporated into the target cells. Within 24–48 h post-electroporation, the cell pool was sorted and tested for the cell condition using DAPI-negative staining. Cell pools with high editing efficiency were selected for monoclonal preparation. Single cells were deposited into 96-well plates by limiting dilution. After approximately 2 weeks of culture, well-growing single clones in good condition were expanded, and genomic DNA was analysed by PCR (primer listed in Supplementary Table 1) and sequencing (Genscript) to confirm precise C terminal-linker-GFP11 integration.
Mutagenesis of β-arrestin IP6 and IDR mutants
Mutation generation was performed using the QuikChange site-directed mutagenesis kit (Agilent). The mutations produced included ΔIP6-N, ΔIP6-C, ΔIP6-N–C, ΔIP6-NT, ΔIP6-NT–C, ΔIDR and ΔCT.
Opto-β-arrestin constructs
Opto-β-arrestin constructs were designed on the basis of those from a past work35. pHR-mCh-Cry2WT (Addgene no. 101221) and pHR-FUSN-mch-Cry2WT (Addgene no. 101223) were cloned into the pcDNA backbone. Overlap cloning was then used to generate all opto-β-arrestin constructs.
Immunofluorescence
HEK293T cells were fixed with 4% PFA for 20 min and then washed three times with phosphate-buffered saline (PBS). Cells were incubated with donkey serum blocking buffer with 0.1% Triton X-100 for 1 h and then washed three times with PBS. Cells were then stained with primary antibodies with β-arrestin 1 (BD Biosciences, 610550, 1:100) or β-arrestin 2 (Abnova, M06J, 1:500) overnight for 4 °C, and then washed three times with 1× PBS. Secondary antibodies (1:500) and Hoechst 33342 (1:1000) were then applied for 2 h at room temperature and washed three times with 1× PBS.
BRET and split nanoluciferase assays
For BRET and split luciferase assays, HEK293T cells were cultured in six-well plates and transiently transfected using polyethylenimine (PEI) as outlined previously. The β-arrestin association was analysed using split NanoLuc components (that is, SmBiT and LgBiT) to explore various protein-protein interactions, including amino–amino (N–N), amino–carboxyl (N–C) and carboxyl–carboxyl (C–C) interfaces. Specifically, 500 ng of the receptor and 100 ng of each β-arrestin construct were introduced into the cells. In the NanoBiT-BRET assay set-up, 500 ng of the receptor and 1 μg of location-specific tagged-mKO (including Cyto-mKO, CAAX-mKO, AP2-mKO and 2xFYVE-mKO) were co-transfected with 200 ng of each NanoBiT β-arrestin variant. Cyto-mKO and CAAX-mKO were used for the normalization of β-arrestin association studies (for example, N–C interactions). For β-arrestin recruitment assays, cells received 500 ng of receptor-LgBiT and 200 ng of N-terminally tagged SmBiT-β-arrestin. To ascertain β-arrestin’s recruitment to specific cellular locales, 500 ng of the receptor and 1 μg of either CAAX-LgBiT or 2xFYVE-LgBiT were used. Endocytosis assays were performed by co-transfecting 200–500 ng of receptor-RLuc with 11.5 μg of 2xFYVE-Venus. For EKAR assays, 25 ng of the biosensor was paired with 1 μg of the receptor and 200 ng of β-arrestin. For TRUPATH assay, 1:1:1:1 μg of receptor:Gαq:Gβ:Gγ were used. On the following day (day 2 after transfection), cells underwent washing with PBS and detachment via trypsinization; they were then seeded onto a Corning Costar 96-well clear-bottomed, white-walled plate at a density of 70,000–100,000 cells per well. The culture medium was replaced with clear minimal essential medium, enhanced with 2% foetal bovine serum, 1% penicillin–streptomycin, 10 mM HEPES, 1× GlutaMAX and 1× antibiotic–antimycotic (Gibco). On day 3, the culture medium was removed, and cells were incubated with 80 μl of 3 μM coelenterazine h in Hanks’ Balanced Salt Solution, further supplemented with 20 mM HEPES buffer for 5 min. Before ligand addition in split luciferase assays, three baseline reads were recorded to assess basal luminescence, which was then normalized to vehicle control conditions and shown as percent change in luminescence. Luminescence and BRET ratios were quantified using a BioTek Synergy Neo2 plate reader at 37 °C. For BRET measurements, a 480 nm wavelength filter for the donor and a 530 nm or custom mKO 542 nm long-pass emission filter for the acceptor were used. Net BRET was determined by subtracting the vehicle BRET ratio from the ligand-induced BRET ratio.
Confocal microscopy
HEK293T cells were seeded onto 35-mm dishes coated with poly-d-lysine and cultured until they reached 50–70% confluence. Following transfection using PEI, cells were incubated for an additional 16–24 h to ensure adequate expression of the transfected constructs. Cells were then washed with PBS and serum-starved for 1 h to synchronize cellular responses. Before imaging, cells were treated for 5 min at 37 °C with either 16HD or a control serum-free medium. After this pretreatment, cells were stimulated with ligands: 10 μM isoproterenol, 1 μM AngII or 1 μM AVP. After stimulation, cells were fixed using 4% paraformaldehyde (PFA) supplemented with Hoechst 33342 (1:1000, Thermo Fisher Scientific) for nuclear staining. Imaging was performed on a Zeiss 880 or 980 confocal microscope, using appropriate laser lines for Hoechst 33342 (400 nm), GFP (480 nm) and mKO (548 nm).
Live cell microscopy
For live cell imaging, HEK293T cells were similarly prepared and transfected as described for confocal microscopy. After the serum starvation period, cells were placed in a live cell chamber system equipped with a temperature stage at 37 °C. All live cell imaging was performed using 63× objective. For optogenetic β-arrestin experiments, two laser wavelengths were used (488 nm for Cry2 activation and 560 nm for mCherry).
Fluorescence recovery after photobleaching
Fluorescence recovery after photobleaching was conducted using a Zeiss 980 confocal microscope with a 63× objective, leveraging a 488 nm laser for targeted bleaching of regions of interest. The procedure aimed to observe fluorescence recovery within these regions of interest over 3 min at specified intervals. Small circular regions of interest were designated on either punctate structures or the diffuse cytosol, and bleaching was performed with the laser at 100% power to diminish fluorescence selectively. Following bleaching, fluorescence recovery was captured, allowing for the analysis of protein dynamics. Recovery data were processed using ImageJ for initial quantification. Microsoft Excel was then used to normalize the fluorescence intensity data, setting the five pre-bleach values to one for a standardized baseline and the immediate post-bleach intensity to 0.
Immunoblotting
Immunoblotting procedures were performed in accordance with previously established protocols. HEK293T cells were cultured in six-well plates and transiently transfected with β-arrestin pcDNA constructs using PEI. Following a 24-h post-transfection period, cells underwent serum starvation using minimum essential medium. Cells were then cooled on ice, rinsed with ice-cold PBS, and lysed using a buffer containing protease inhibitors Phos-STOP (Roche) and complete EDTA-free (Sigma). Lysates were agitated at 4 °C for 45 min and then centrifuged at more than 12,000g for 15 min at 4 °C to remove insoluble debris. The resulting supernatant was processed further. Protein samples were separated on SDS-10% polyacrylamide gels and transferred onto nitrocellulose membranes for blotting. Primary antibodies targeting phospho-ERK (1:1000 dilution, Cell Signalling Technology) and total ERK (1:1,000 dilution, Millipore Sigma) were applied overnight to evaluate ERK activation. The A1-CT antibody, specific for β-arrestin isoforms, and α-tubulin (Sigma-Aldrich) as a loading control were also used. Detection was facilitated by horseradish peroxidase-conjugated secondary antibodies (mouse anti-rabbit IgG or anti-mouse IgG) at a 1:3,000 dilution. The detection of immune complexes on the membranes was achieved using SuperSignal enhanced chemiluminescent substrate (Thermo Fisher) and documented with imaging equipment.
Imaging of β-arrestin puncta
On day one, HEK293T cells were transfected in six-well dishes and incubated for 24 h. On day two 70–100,000 cells were plated on 96-well poly-d-lysine-coated plates (Thermo Scientific). On day three, cells were fixed with 4% PFA. After 30 min of fixation, cells were washed with 1× PBS for 10 min × 3. For acquisition, Image Xpress Pico Automated Cell Imaging System (Molecular Devices) was used.
Quantification and statistical analysis
Quantification of split GFP-β-arrestin puncta
For analysis, Image Xpress Pico Automated Cell Imaging System (Molecular Devices) was used. Thresholds or size and image intensity were made to negative controls. Images were captured at 20× and about 5,000 cells were analysed per well. Puncta were normalized to each cell with the nuclear marker.
Image analysis
Confocal Images were visualized using ImageJ. All image adjustments performed were identical and consistent. The line scan analysis function was used to measure the intensity of each channel.
Optogenetic puncta quantification
Condensates were quantified on a per cell basis on a single optical plane using the ‘Surfaces’ module in Imaris (Bitplane; v.10.2). Cell outlines were determined from the first 10 s of the time-lapse, before condensate formation. Condensate detection thresholds were determined on a per-cell basis using the mean intensity of the cell measured at the start of each time-lapse. The remaining surface detection parameters were held constant across cells and conditions (smoothing applied = true, surface grain size = 0.07 μm, largest sphere diameter = 3 μm). For each cell, the total number of condensates were quantified at 1 s intervals over a 120 s imaging period. Two to four cells were quantified across multiple independent images for an average of nine cells per experimental condition. For quantification, only cells with similar expression were used for quantification.
Line scan analysis
Spatial localization of β-arrestin and GPCRs were quantified using line scan analysis in ImageJ (National Institutes of Health; v.1.54f). For each condition, a straight line segment (18–20 μm) was drawn manually using the line tool such that each line extended from one side of the cell membrane to the opposite side, spanning the full width of the cell. Cell membrane was determined using the GPCR channel. Fluorescence intensity profiles for the β-arrestin and GPCR channels across the entire line segment were extracted using the plot profile function.
Statistics and reproducibility
Statistical methods were not used to predetermine sample size. Blinding and randomization were not used. Data were analysed in Microsoft Excel and graphed in GraphPad Prism v.11.0 (GraphPad). Dose-response curves were fitted to log agonist versus stimulus with three parameters with the minimum baseline corrected to zero. Statistical tests were performed using a two-way ANOVA when comparing different β-arrestin mutants in time response assays AUC. Further details of statistical analysis and replicates can be found in the figure legend. Crucial plate-based experiments were independently replicated by at least two different investigators whenever feasible. Specific P values for Figs. 1–5 can be found in Supplementary Table 2.
Materials availability
All plasmids generated in this study will be distributed on reasonable request.
Experimental model and subject details
All cell lines are periodicially tested for mycoplasma commnication. HEK 293T cells, including a β-arrestin 1–2 KO variant, were cultured in Dulbecco’s modification of Eagle’s medium with 10% foetal bovine serum and 1% antibiotic–antimycotic solution from Gibco, under conditions of 37 °C and 5% CO2 humidity. The β-arrestin 1–2 KO cells, created through CRISPR–Cas9 genome editing, were authenticated by immunoblot analysis and obtained from A. Inoue.
For experiments requiring confocal microscopy, both HEK293T and β-arrestin 1–2 KO cells were seeded on 35-mm glass-bottomed dishes pre-coated with either poly-d-lysine or rat tail collagen, aiming for a confluence between 40% and 70%. In the case of 96-well plate assays, cell density was adjusted to 70,000–100,000 HEK293T cells per well.
Transient transfections were performed using OPTI-MEM and PEI at a PEI-to-DNA mass ratio of 3:1. Cells designated for confocal microscopy analysis were prepared and imaged after 16–24 h post-transfection, adhering to the same timeline for BRET and split nanoluciferase assays.
Reporting summary
Further information on research design is available in the Nature Portfolio Reporting Summary linked to this article.

